- MATIC’s bullish pattern formation offers hope amidst a bearish sentiment and sluggish price action.
- Technical indicators present a mixed outlook, suggesting potential for growth but with significant challenges ahead.
As the crypto market rides a wave of bullish sentiment, most digital assets are enjoying the green pastures of growth and prosperity. However, Polygon (MATIC), a key player in the blockchain scalability arena, finds itself in a peculiar position. Despite the favorable market conditions, MATIC’s price chart paints a different picture, signaling caution to investors and traders alike.
Market Dynamics and Polygon Performance
Currently trading at $1.05, with a hefty market capitalization surpassing the $10 billion mark, MATIC’s sluggish price action stands in stark contrast to the broader market trend. This discrepancy has cast a shadow over market sentiment towards the token, with the Weighted Sentiment indicator signaling a bearish outlook among investors.
Despite the prevailing bearish sentiment, MATIC’s price trajectory hints at a bullish pattern formation, offering a silver lining to the otherwise cloudy scenario.
$MATIC Here we go 📈
Symmetrical Triangle Upside Breakout/Retest has confirmed on the Weekly timeframe Chart.
Send it the Mars 🚀🚀#Crypto #MATIC #Polygon #MATICUSDT pic.twitter.com/SBtVGGg15i
— Captain Faibik (@CryptoFaibik) February 27, 2024
Captain Faibik, a renowned figure in the crypto analysis sphere, recently pointed out that MATIC is on the cusp of breaking out from a bullish triangle pattern. This potential breakout could pave the way for MATIC to reach the coveted $2 mark in the forthcoming weeks, provided the market dynamics play in its favor.
Challenges on the Horizon
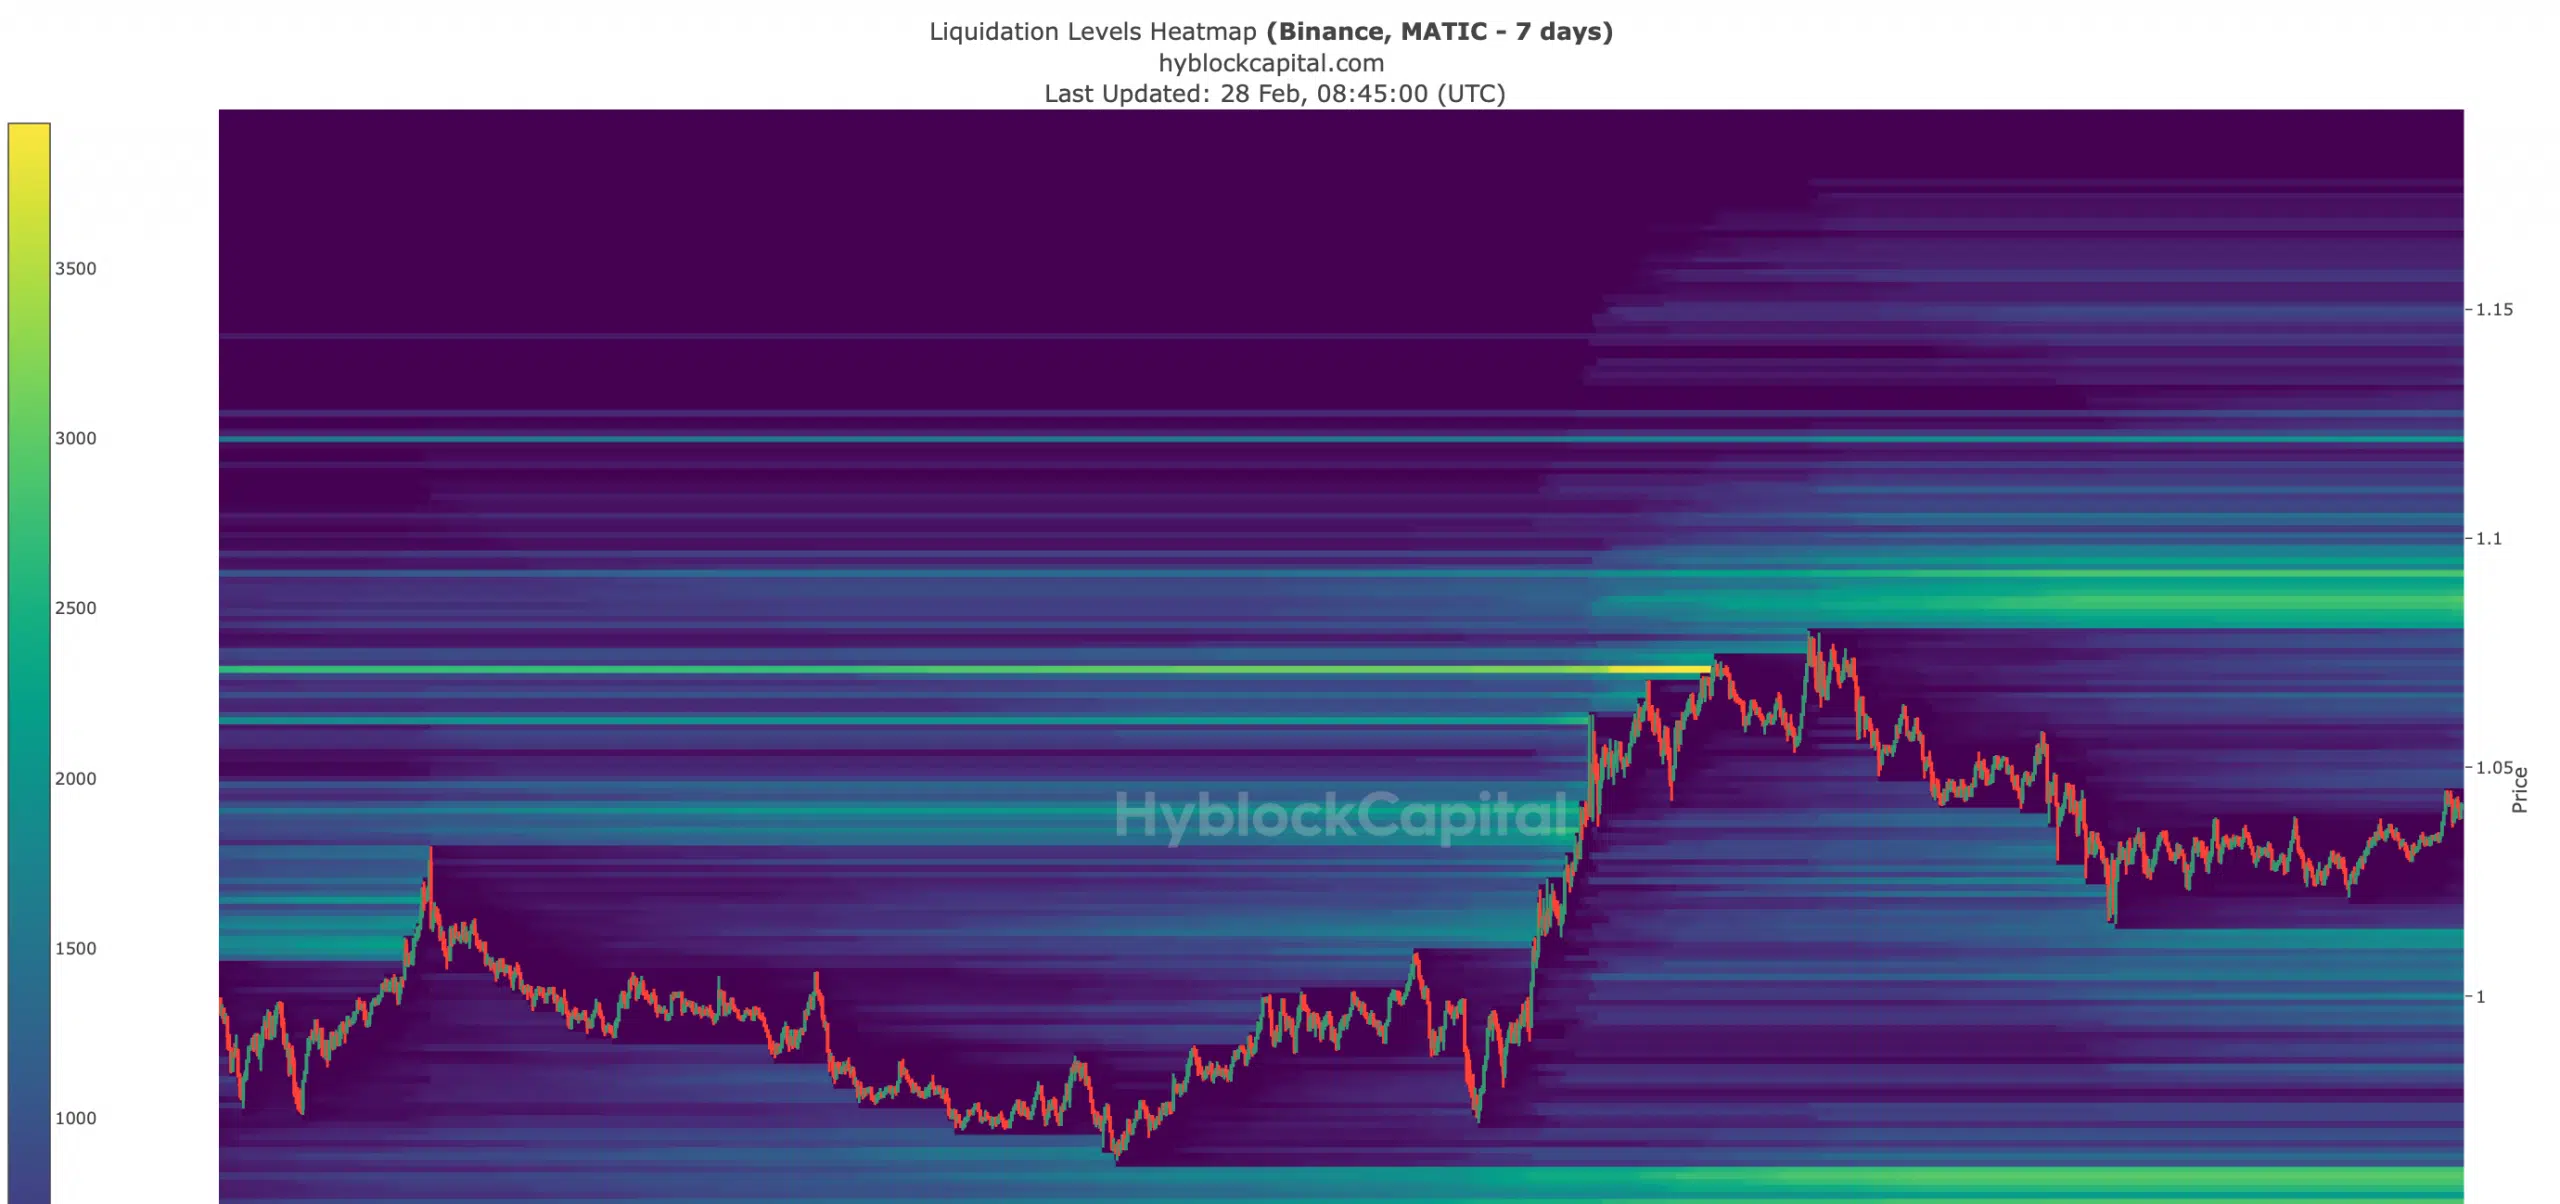
However, the journey to $2 is fraught with challenges. Key resistance levels loom large, threatening to curb the token’s ascent. Delve into Hyblock Capital’s data sheds light on another significant hurdle: an expected surge in liquidations at the $1.08 mark.

Such liquidations could trigger price corrections, adding another layer of complexity to MATIC’s path to growth.
Technical Indicators: A Mixed Bag
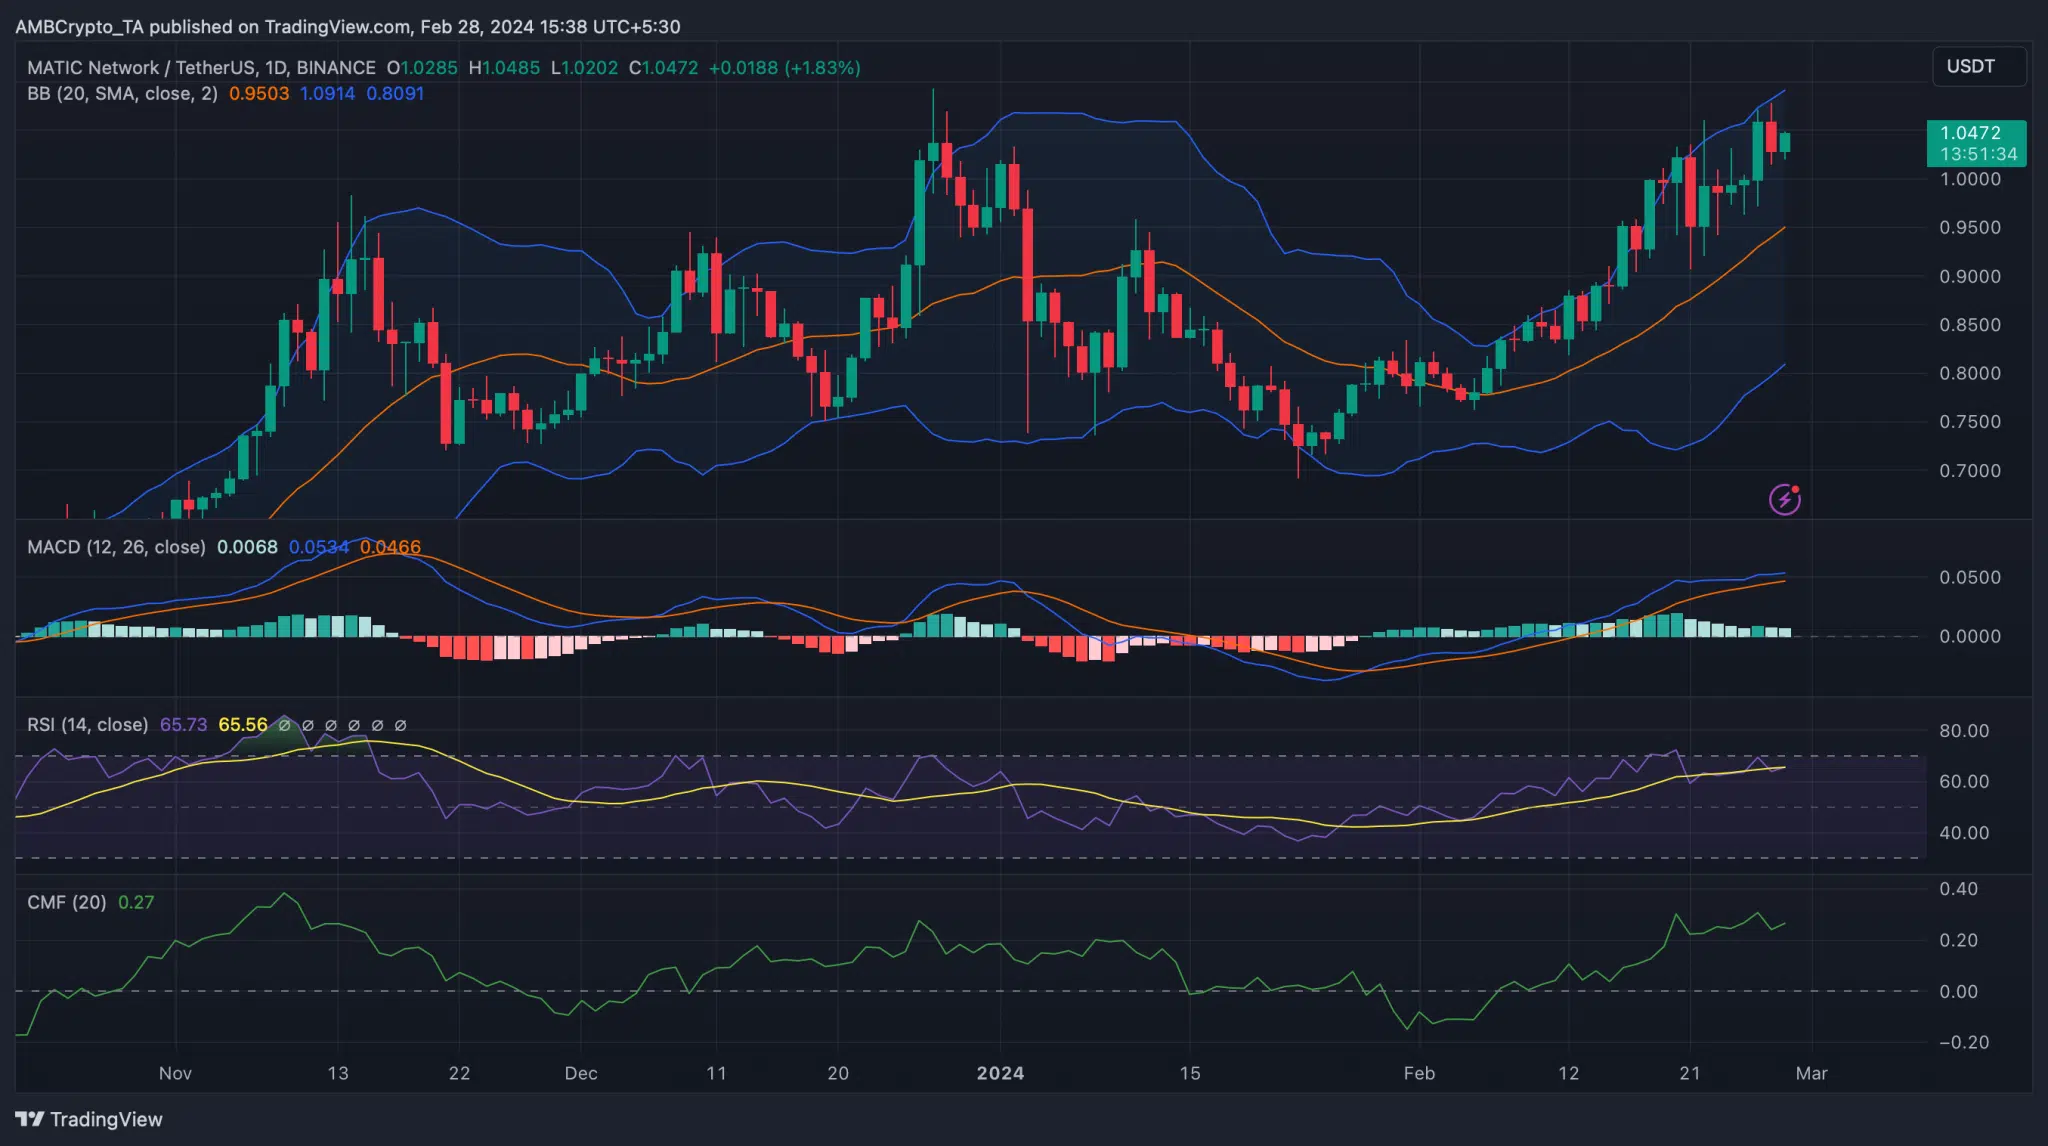
Thorough examination of MATIC’s daily chart reveals a volatile environment, as evidenced by the Bollinger Bands. The MACD, however, offers a glimmer of hope, indicating a buyer’s market.

The Chaikin Money Flow (CMF) index’s uptick further bolsters the case for an impending price uptick. Yet, the Relative Strength Index (RSI)’s downward trajectory serves as a reminder of the challenges ahead, suggesting that investors might need to temper their expectations for a swift rally to $2.
Other technical analysis also implies significant growth for MATIC, it could skyrocket 90%, as previously reported by ETHNews. At the time of writing, the price of XRP has risen 0.42% in the last 24 hours, reaching a price of $1.04. This represents an increase of 7.71% over the past 7 days.


