- MATIC breaks above the $1 threshold after a 20% gain, indicating upside potential towards $1.20 in weeks.
- Indicators suggest overbought MATIC; however, the technical structure maintains a promising outlook for further gains.
Recently, Polygon’s MATIC token, MATIC, has once again broken through the dollar barrier, a sign that many investors interpret as an indication of future gains. This recovery follows a 20% increase in MATIC’s value over the past week, a move that caught the attention of analysts and cryptocurrency enthusiasts alike.
Indicators at a Glance
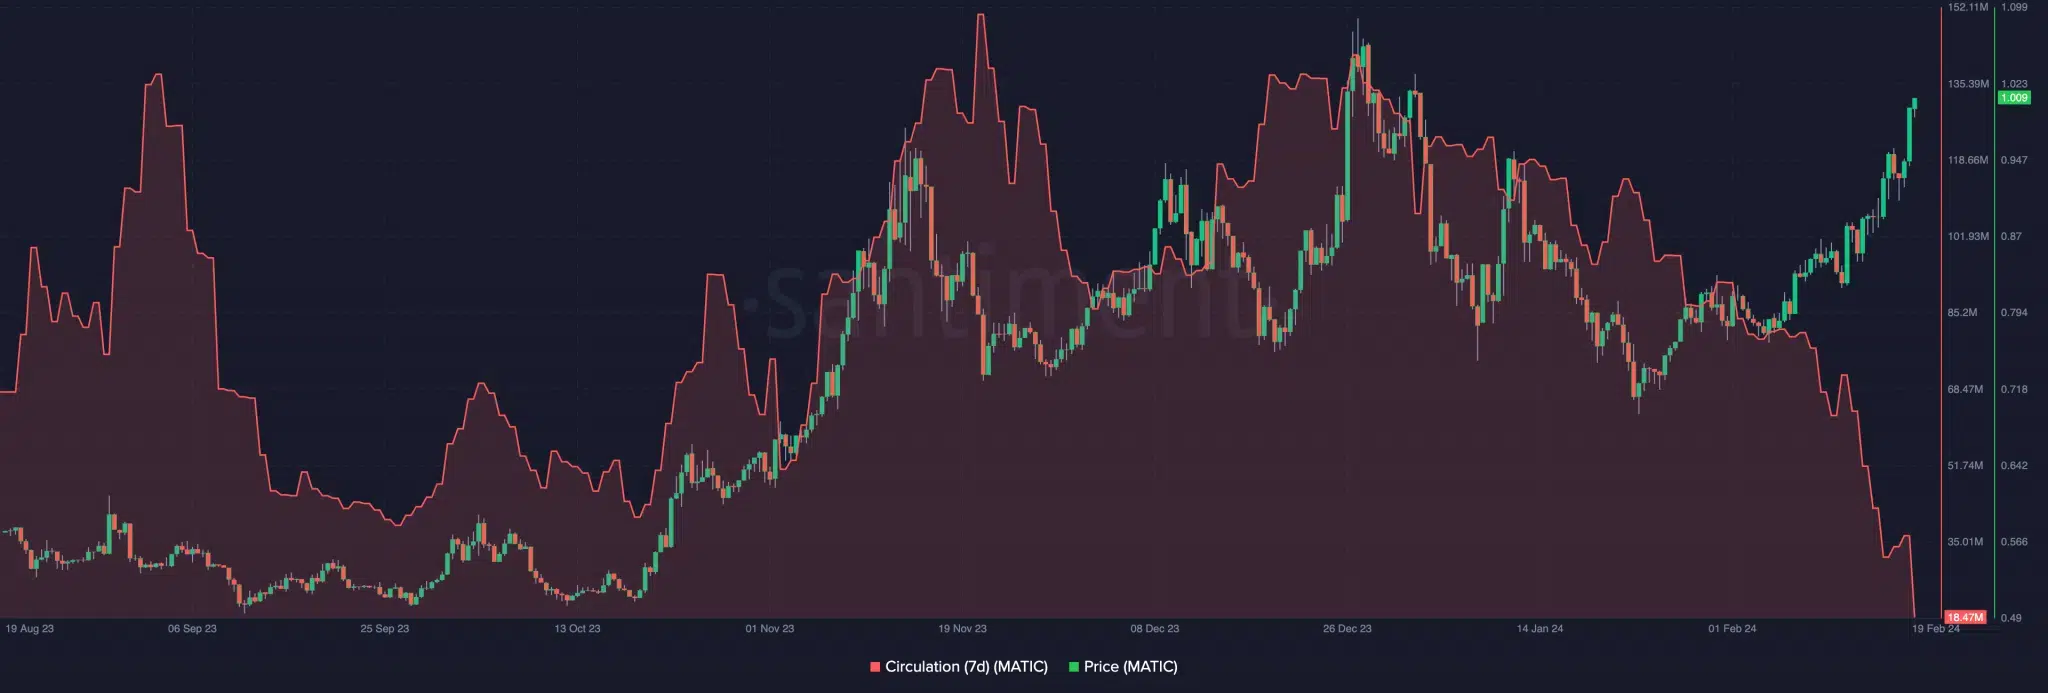
A decline in MATIC’s circulation could suggest price stability or even upside potential. Contrary to what one might think, this decrease in circulation, which is often associated with less selling pressure, opens the door to potential price increases.

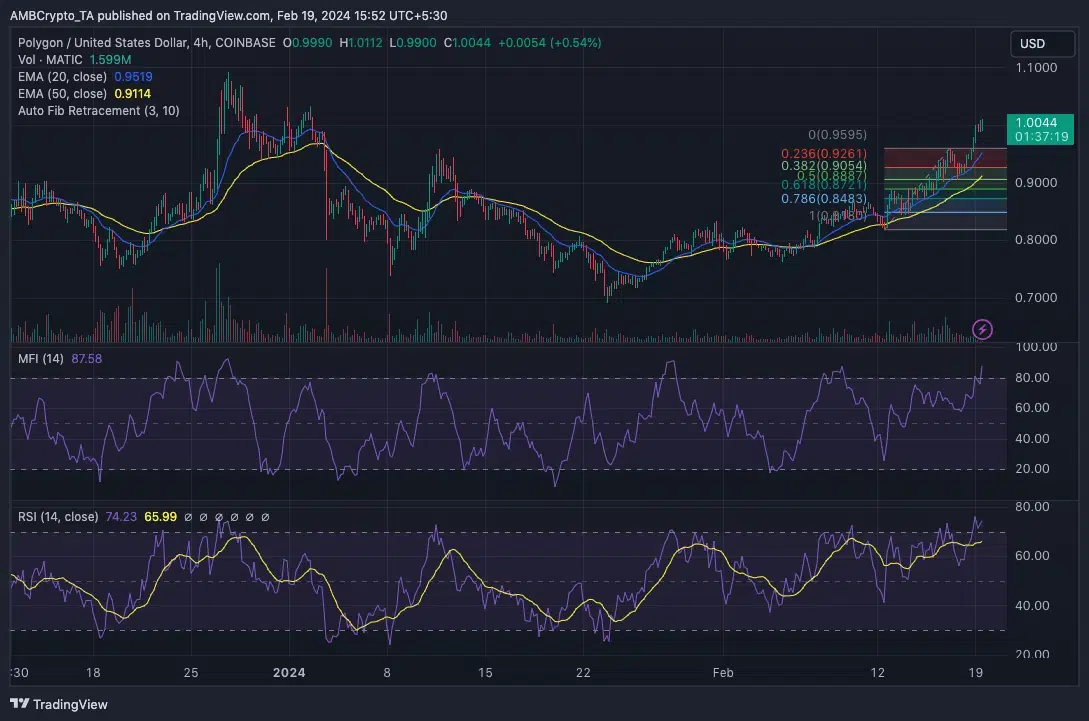
If this trend continues, MATIC could experience an additional 20% increase, potentially reaching $1.20 in the coming weeks. However, it is important to consider that the Money Flow Index (MFI) signals that MATIC is in an overbought zone, which could indicate a possible near-term correction.
MATIC Technical Scenario
From a technical perspective, key support levels are located at $0.88 and $0.92, corresponding to the 0.618 and 0.236 Fibonacci retracement levels, respectively. Although the RSI also indicates overbought, the disposition of the 20-day EMA above the 50-day EMA suggests a bullish outlook.

The Path to Long Positions
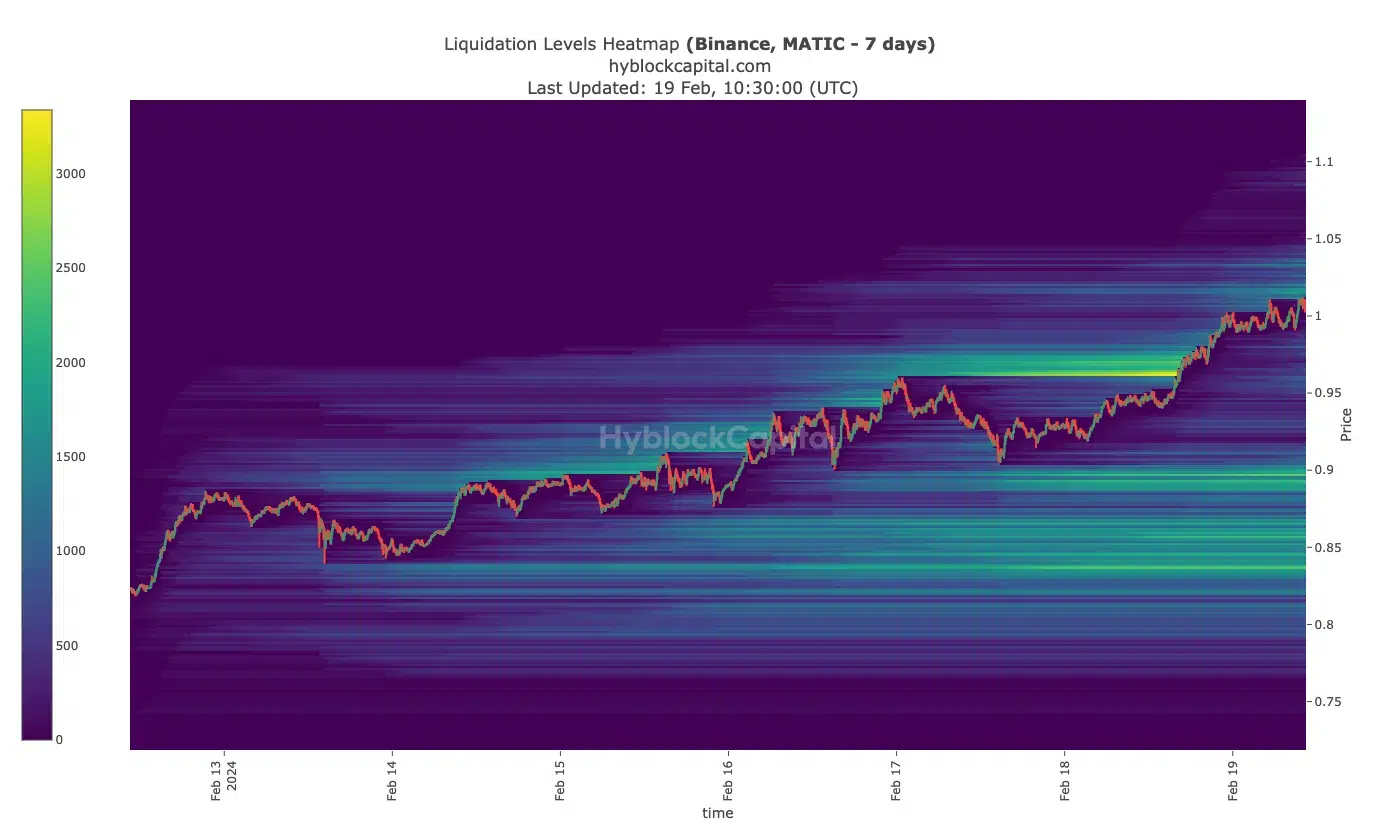
The Liquidation Heat Map analysis shows price zones where highly leveraged positions could face liquidations, specifically between $0.89 and $0.96.

However, above $1.05, the outlook favors long positions, recommending caution with the use of high leverage due to market volatility.
Despite the optimism, investors should proceed with caution. The possibility of a correction before continuing its ascent should not be ruled out. Therefore, both long and short positions should exercise caution, avoiding excessive bets in a market that, although promising, remains unpredictable.


