


- Litecoin approaches a critical price level, historically followed by rallies.
- On-chain metrics and technical indicators suggest a potential uptrend, albeit with caution due to mixed signals.
Litecoin (LTC) has recently found itself at a critical juncture, despite the broader market’s bullish momentum. Investors harboring concerns over Litecoin’s stagnation may soon witness a change in tide, as the digital currency approaches a historically significant price level.
One of the interesting things about this coin is, it has several diamond hand hodlers who have faithfully held LTC in their wallets for more than two years, as ETHNews had formerly announced.
Litecoin Current Market Stance
At a glance, Litecoin’s performance in the market has been relatively static, especially when juxtaposed against the promising upsurges of its counterparts.
According to the latest figures from CoinMarketCap, LTC’s price has seen a marginal increase over the last 24 hours, with the coin trading at $75.59, underpinned by a market capitalization exceeding $5.6 billion. Yet, the subtleties beneath these figures hint at an impending rally.
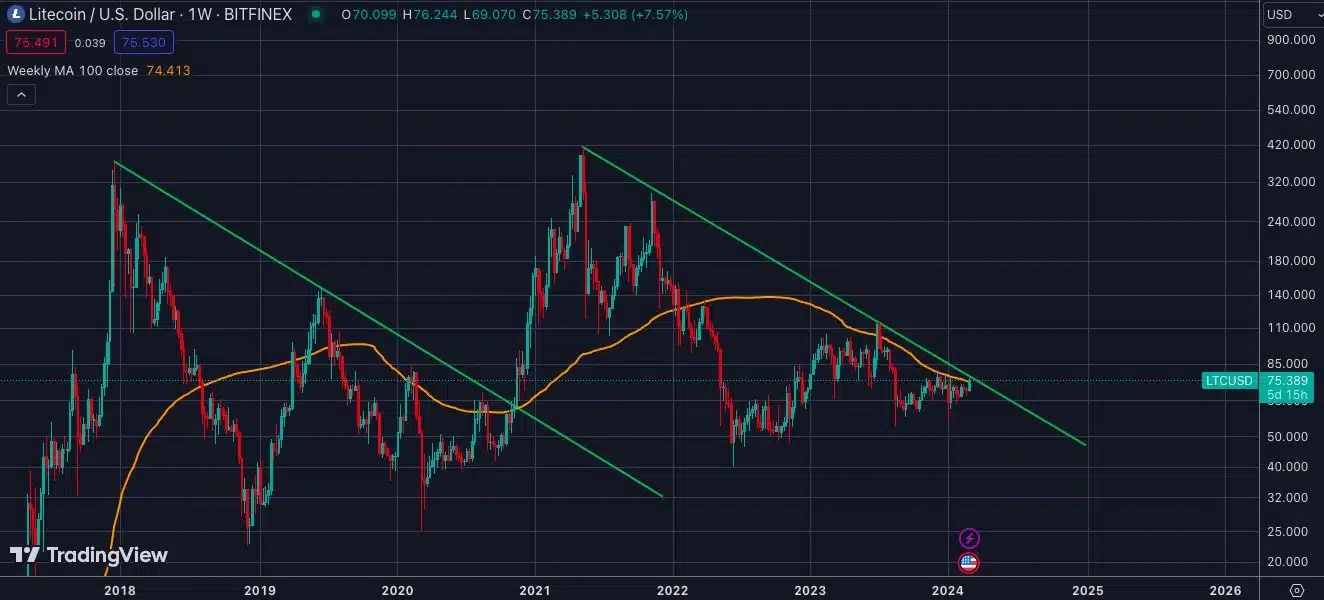
The current price trajectory of Litecoin eerily mirrors a pattern previously observed, which culminated in a notable bull run back in 2021. Analysts are eyeing a potential break above a diagonal trend line on LTC’s price chart, a movement historically associated with significant northward momentum.
Diving deeper into Litecoin’s on-chain metrics provides a more granular perspective on its potential. A noteworthy observation is the downtick in Litecoin’s Network Value to Transactions (NVT) Ratio, a metric derived by dividing the market capitalization by the on-chain volume (in USD).
A decrease in the NVT Ratio typically signals the undervaluation of an asset, laying the groundwork for a potential uptrend.
Other Positive Indicators
Further bolstering the bullish outlook are several other optimistic metrics. The MVRV ratio of Litecoin has seen an uptick, alongside sustained high social volume, reflecting the coin’s unwavering popularity.
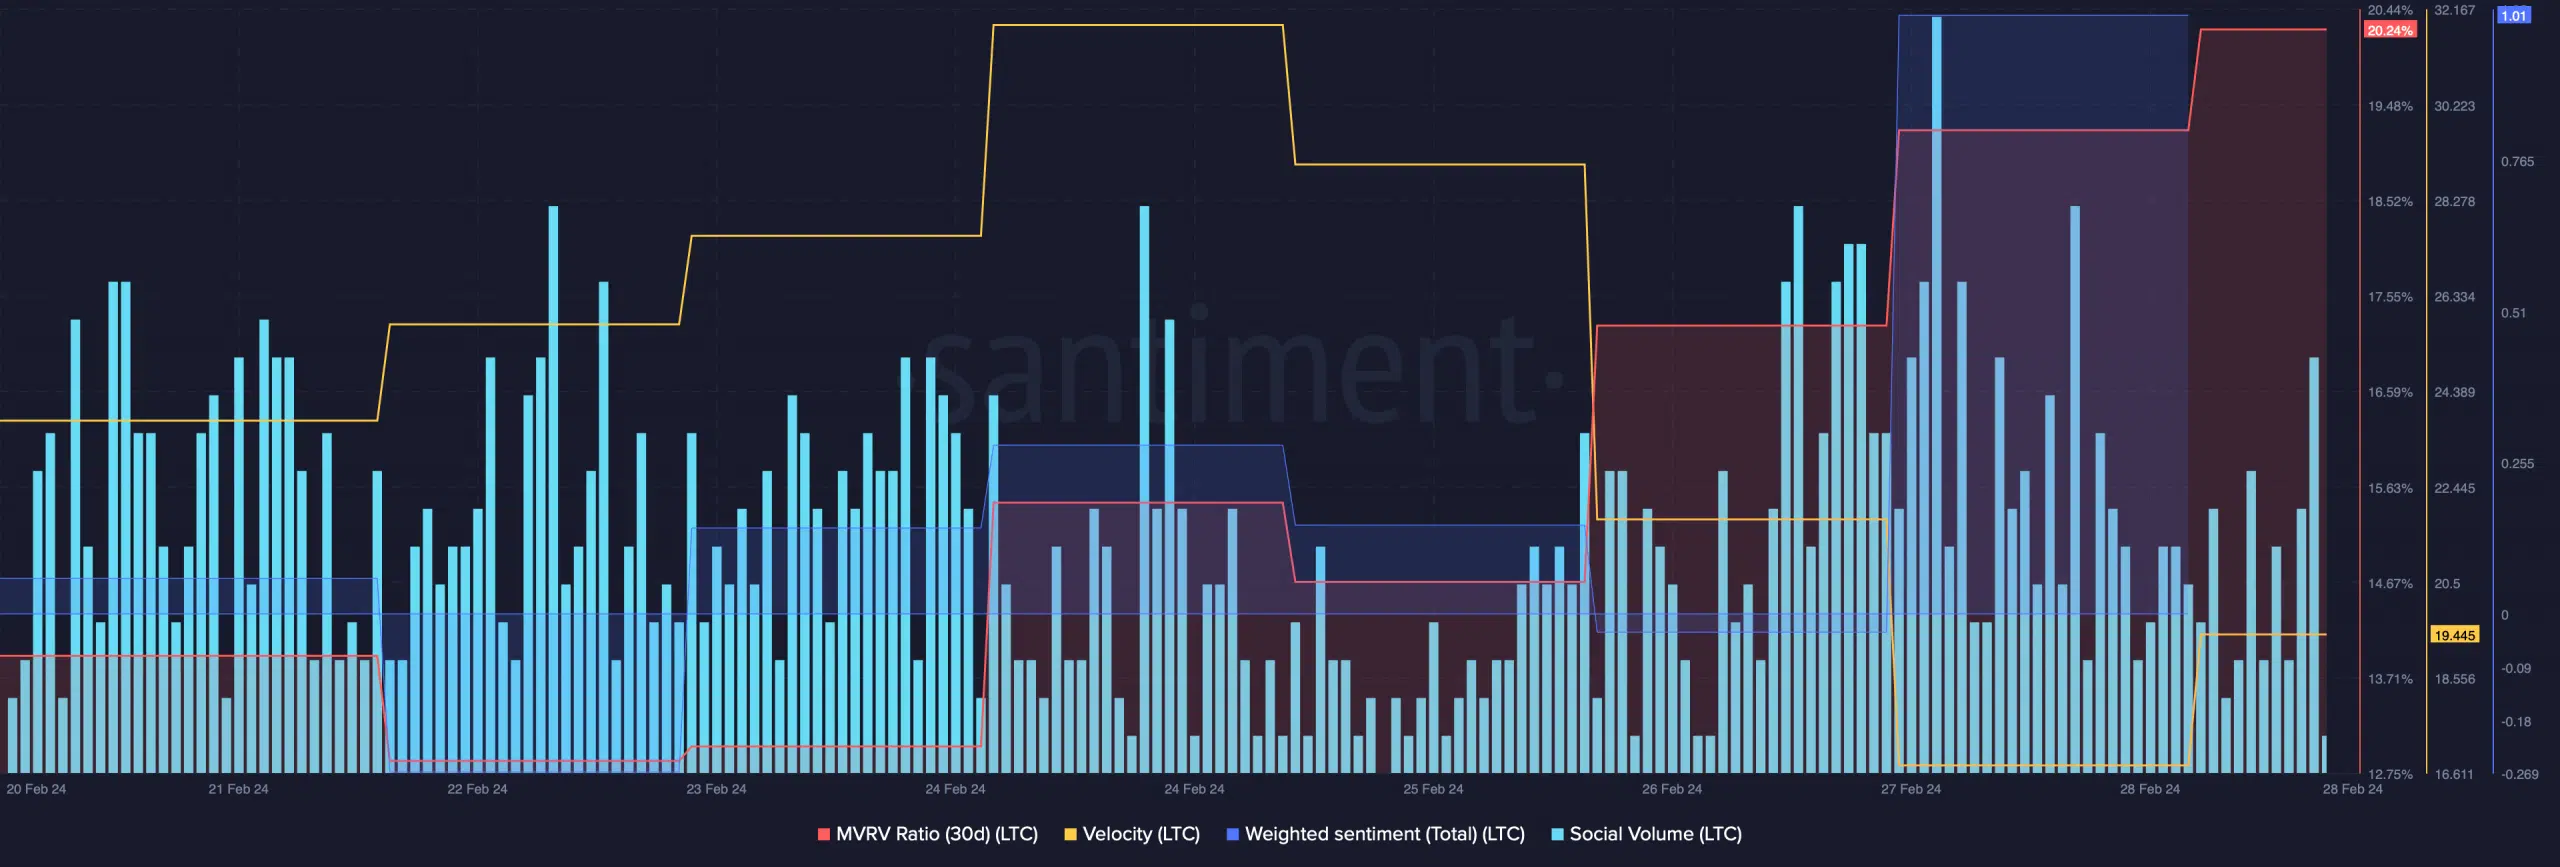
The weighted sentiment analysis also reveals a predominantly bullish sentiment in the market. However, a slight dip in network activity, as evidenced by a decrease in velocity, presents a mixed signal.
Technical Analysis: Signs of a Bull Rally
The technical landscape for Litecoin reinforces the bullish sentiment, with the MACD indicator showcasing a bullish crossover.
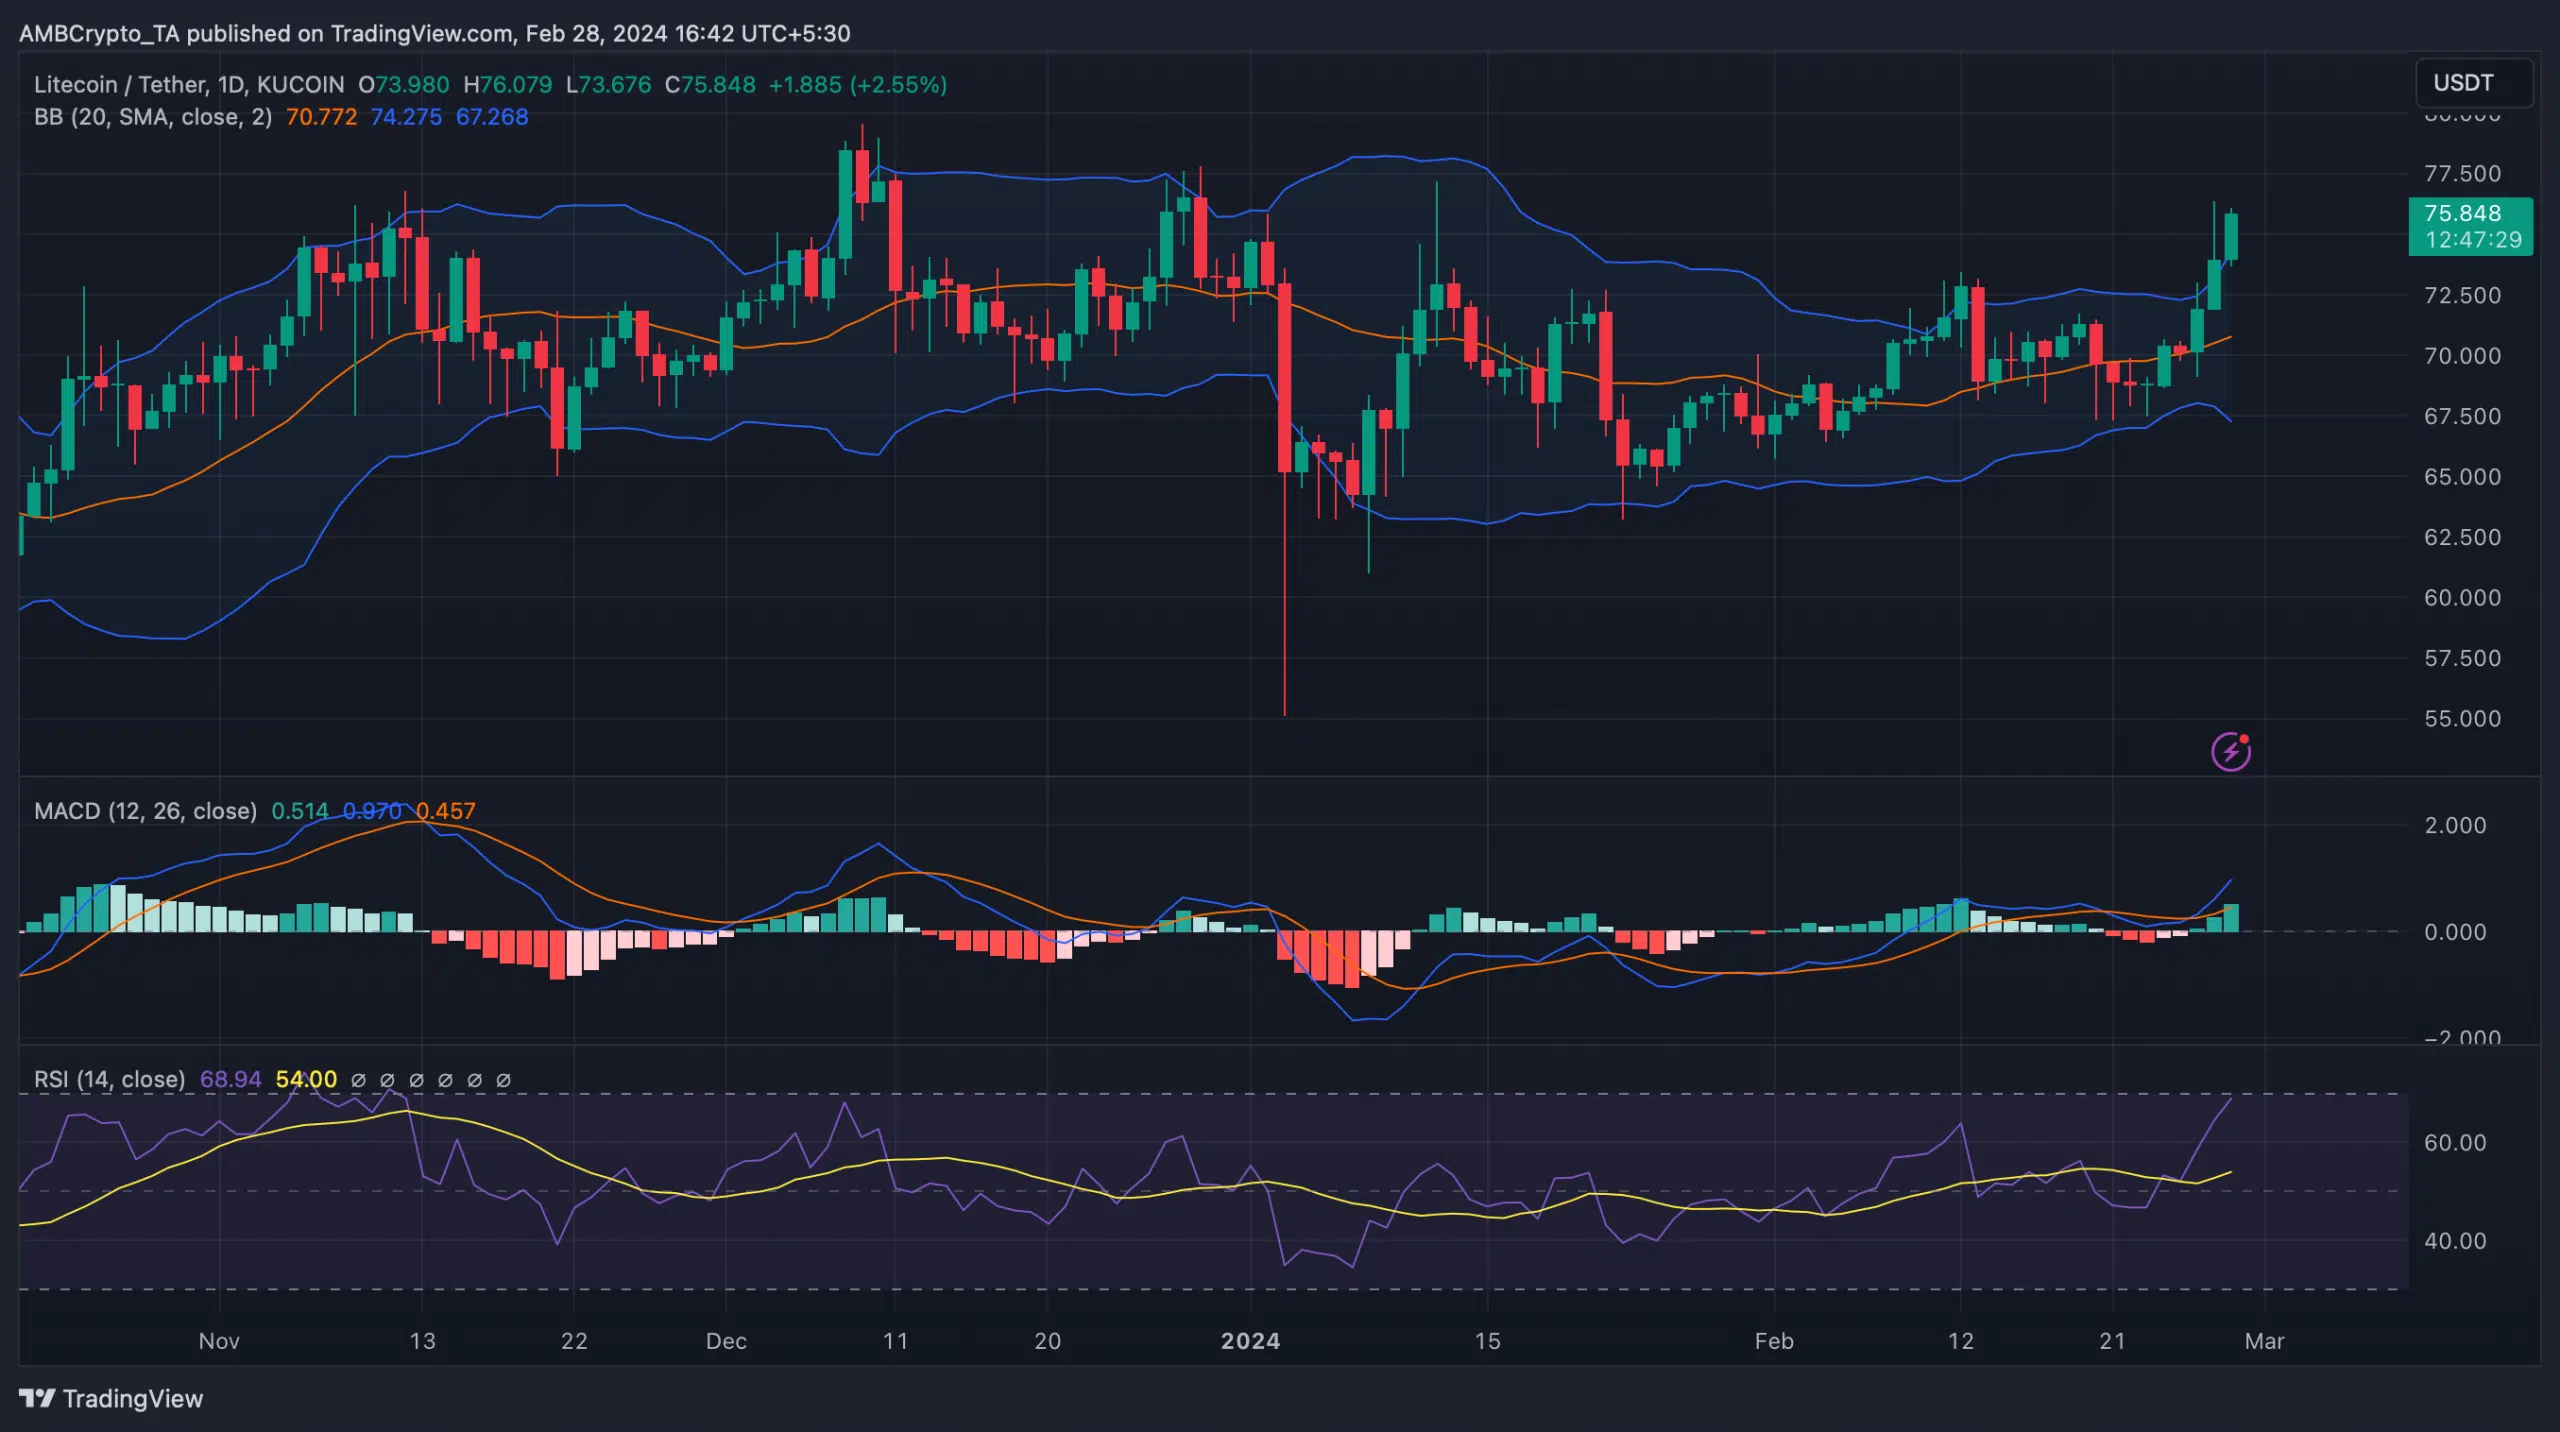
Nevertheless, caution is advised as the Relative Strength Index (RSI) approaches the overbought territory, potentially leading to increased selling pressure. Moreover, Litecoin’s brush with the upper boundary of the Bollinger Bands suggests a heightened risk of a sell-off.
At the time of writing, the price of LTC has risen 11.01% in the last 24 hours, reaching a price of $82.16. This represents an increase of 19.80% over the past 7 days.


