- Solana (SOL) shows recovery with positive weekly candles, reaching $119 on February 14, after a low of $79 in January.
- Technical analysis suggests a possible double top for SOL compared to 2023 highs, indicating a key inflection point.
Since January 23, the price of Solana (SOL) has been on the rise, approaching the highs reached during the previous year. Despite overcoming recent resistance, it still faces longer-term barriers. This leads us to question whether we are facing a true turnaround or whether this is a passing phenomenon in the vast world of cryptocurrencies.
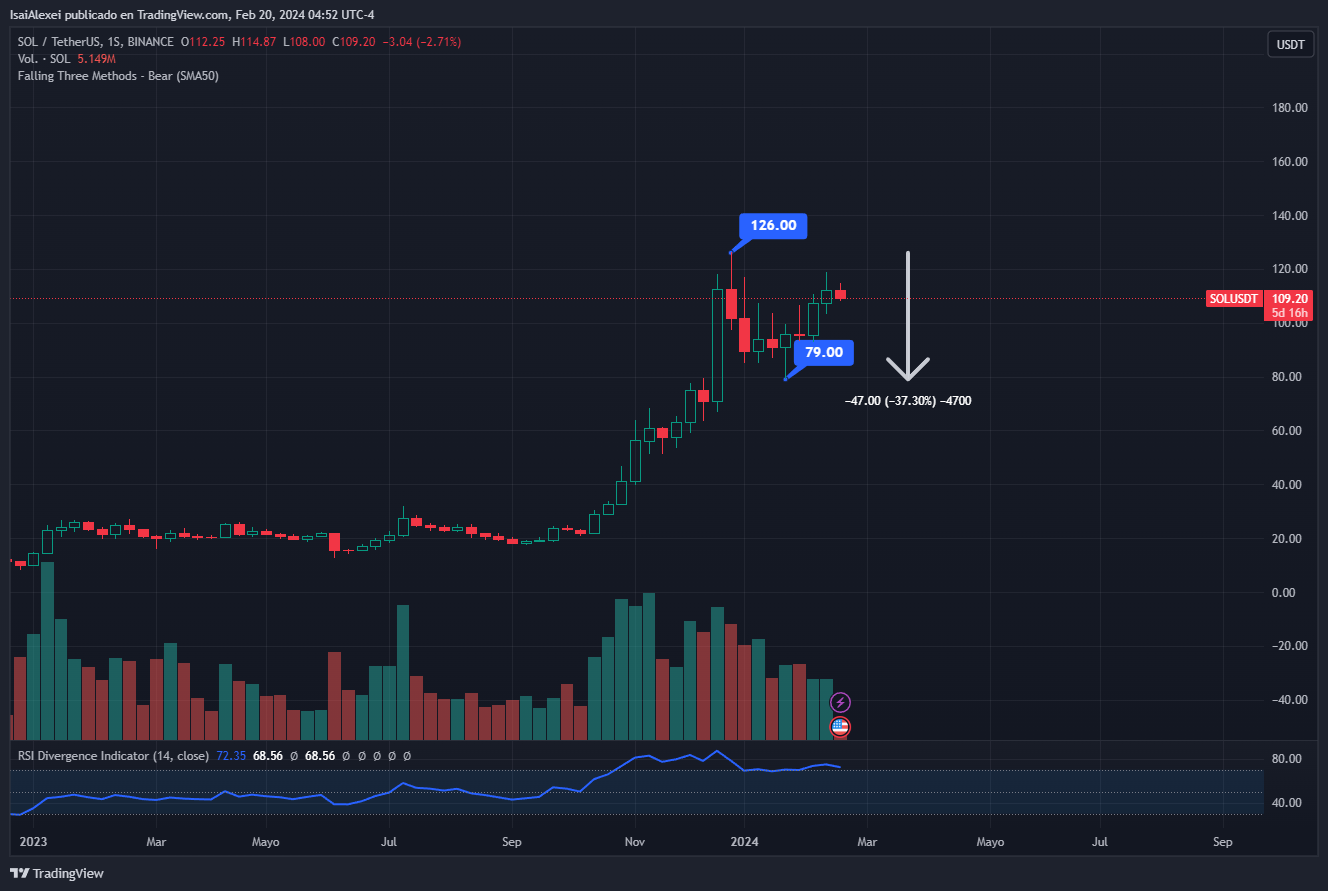
Looking at the weekly data, we note that SOL peaked at $126 in December last year, only to suffer a pullback. This decline found its lowest point at $79 earlier this year.

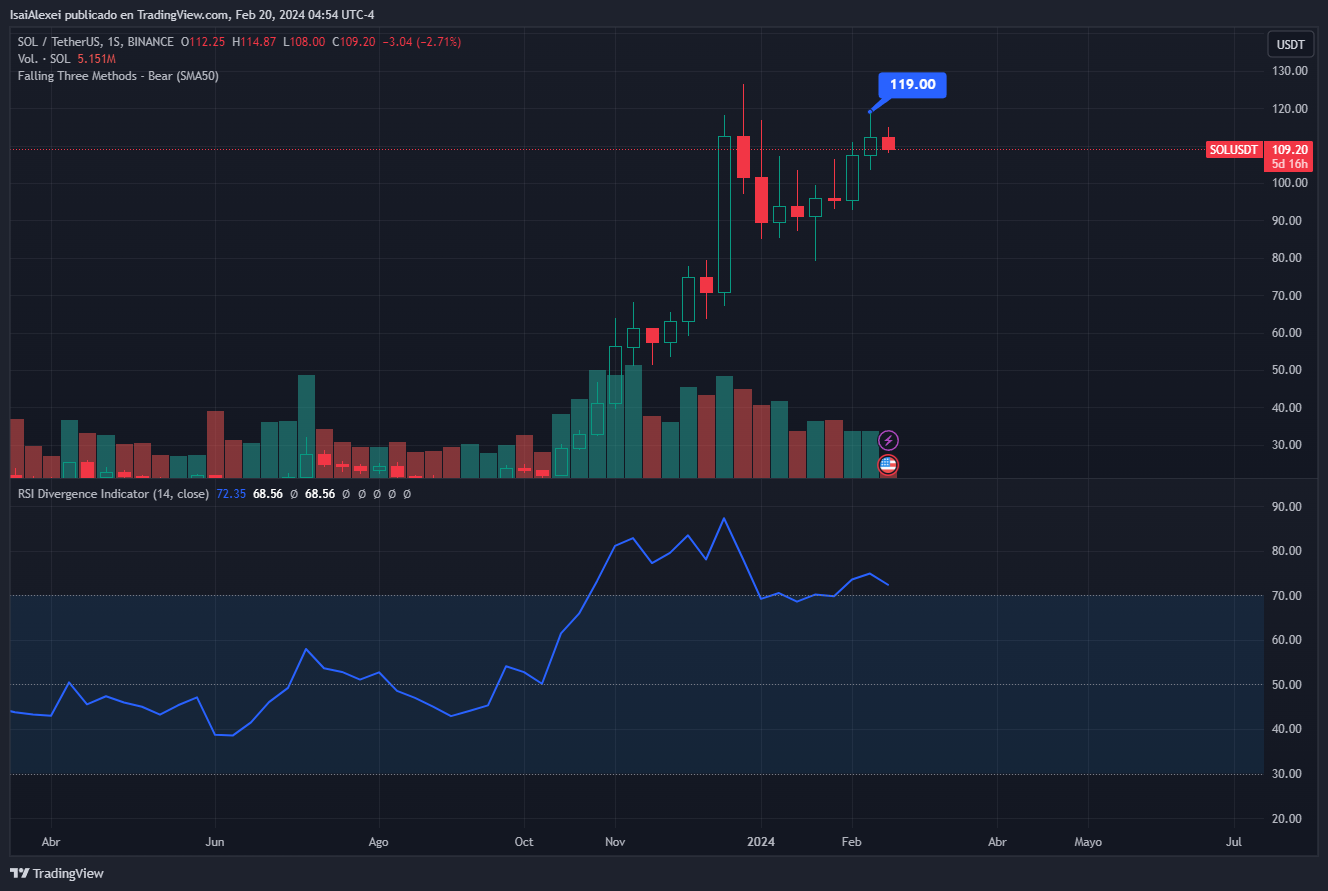
However, the price of SOL has begun to recover, marking a series of positive weekly candles and reaching a recent high of $119 on February 14, 2024. This rally raises the possibility that SOL is forming a double top compared to its previous high.

The weekly Relative Strength Index (RSI) indicates a bearish trend. This indicator, used by traders to assess whether an asset is in an overbought or oversold condition, shows an increase and is positioned above 50, but also reveals a bearish divergence that usually anticipates declines.
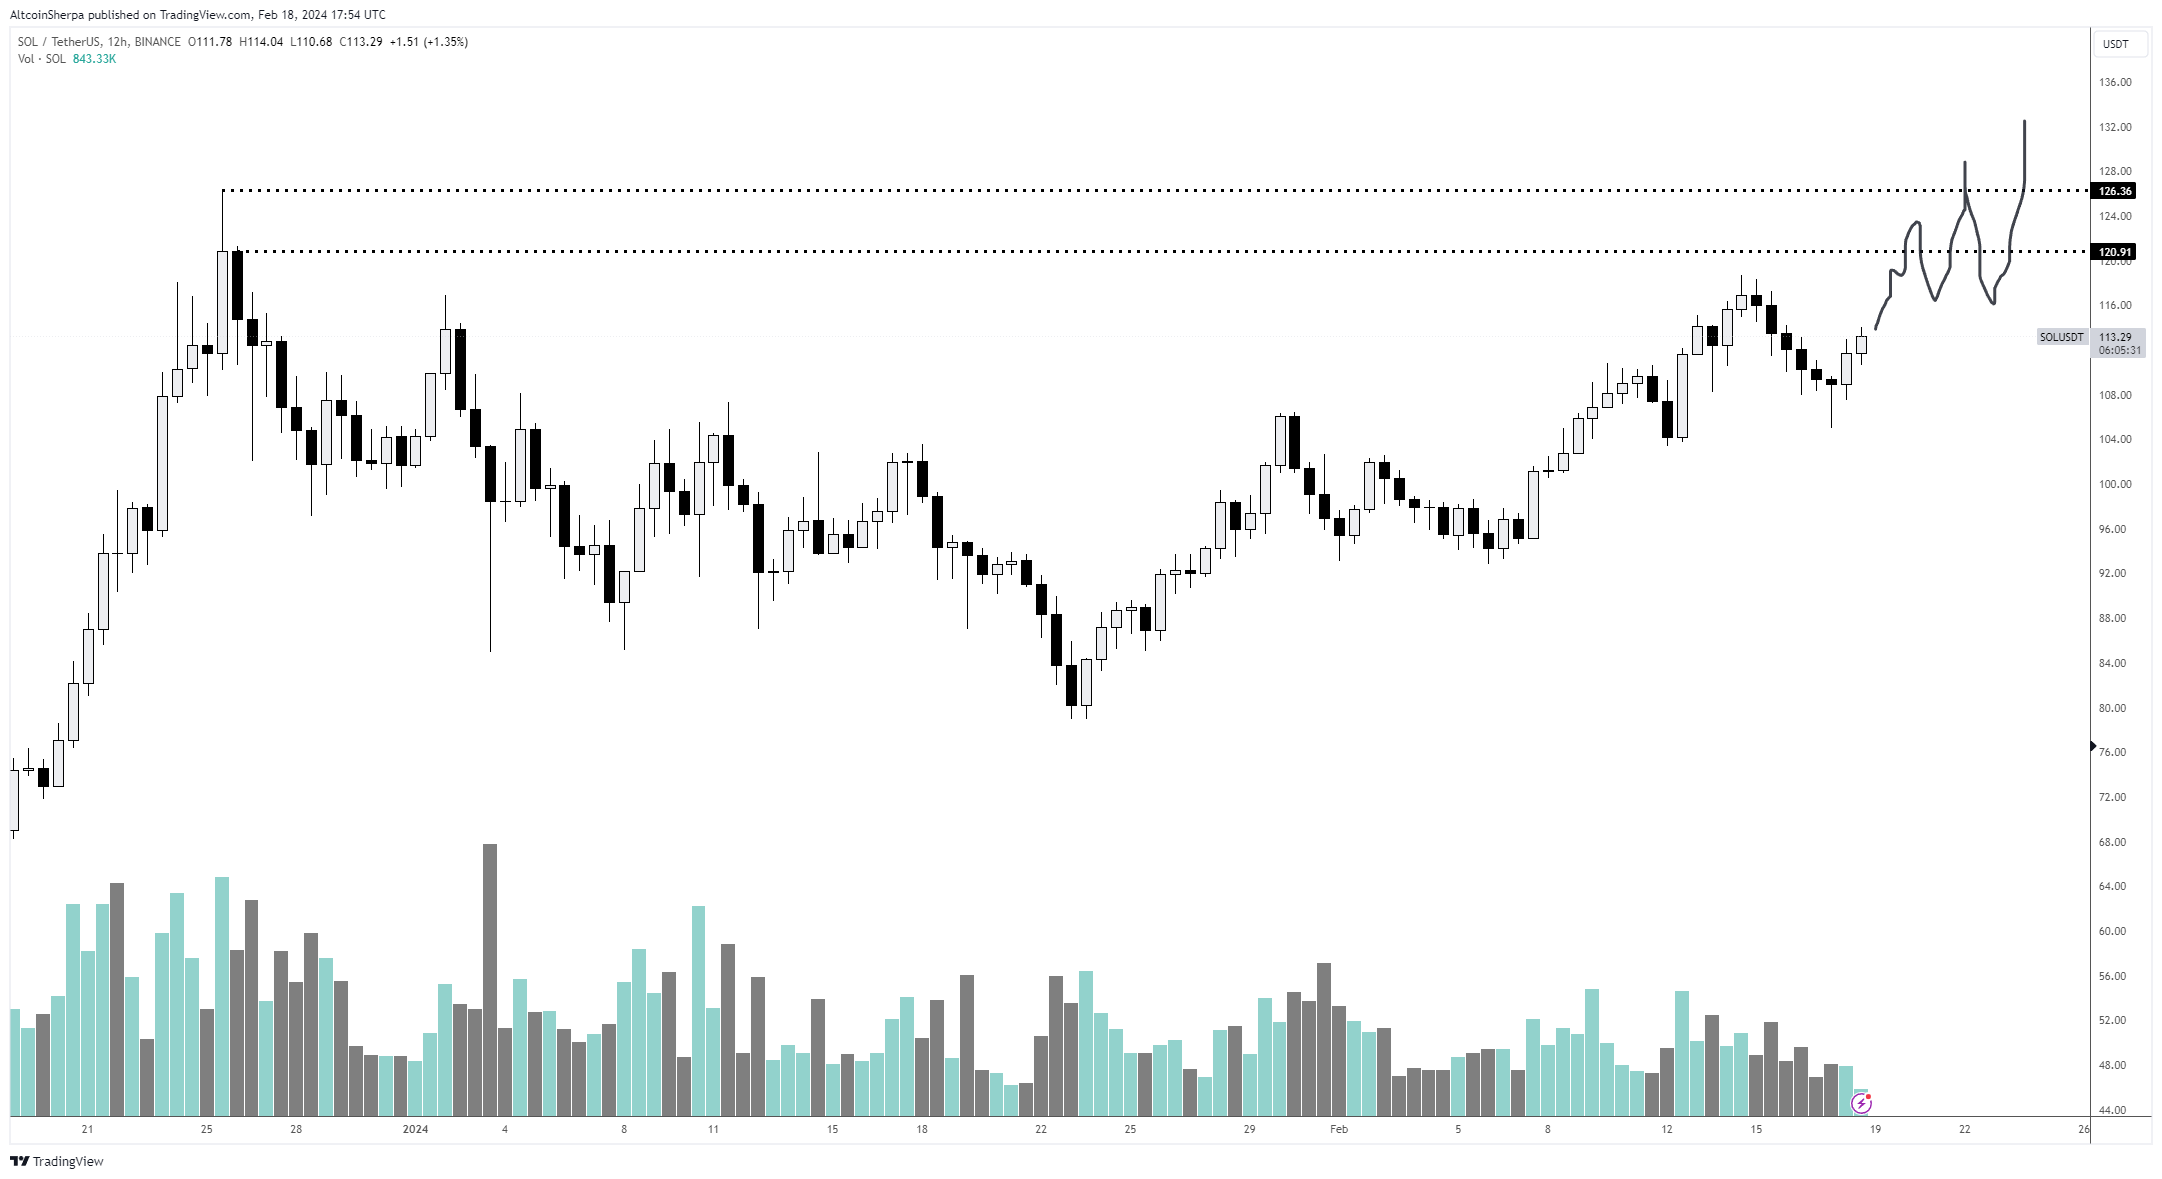
Cryptocurrency specialists have a positive outlook on SOL’s future. One well-known trader, Altcoin Sherpa, shows his optimism, mentioning that although he anticipates some selling near the highs due to the time between peaks, the overall market trend remains positive. He suggests that acquiring and holding SOL could be more profitable than waiting for a 20% correction.
$SOL: It's a bizarre chart seeing this grind up slowly. I expect some sort of selling to happen around the highs given the length of time spent in between each peak but the entire market is still up only right now. I think that expecting any huge correction for #Solana is meh… pic.twitter.com/8VnHcJ4bNX
— Altcoin Sherpa (@AltcoinSherpa) February 18, 2024
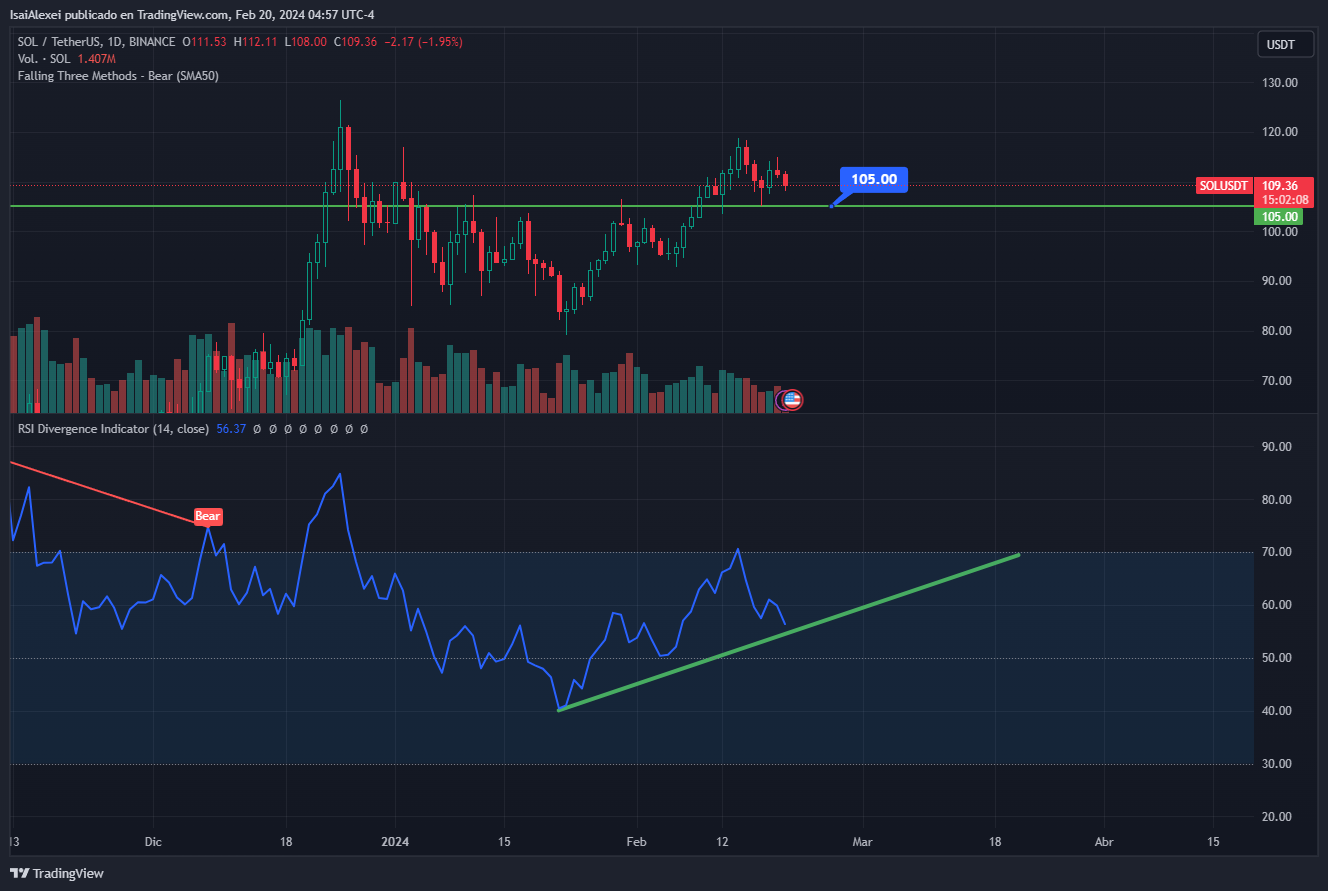
Regarding price expectations for SOL: did we experience new highs in February? Although the weekly analysis shows uncertainty, the daily chart offers a more optimistic view, supported by price dynamics, wave analysis and RSI. The price evolution indicates that SOL has broken above the $105 barrier, coinciding with a rising RSI.

In addition, wave analysis suggests that SOL is in the last phase of its uptrend that began in June. If this pattern is confirmed, SOL could approach major resistance at $145, which would represent a 30% increase over its current value.

However, a drop below $105 would indicate a correction in progress, with the possibility of a 40% decline to the next support at $69, determined by the 0.5 Fib retracement level.
This analysis underscores the volatility of the cryptocurrency market and the need to stay current. With its recent performance, Solana reminds us how dynamic this sector is, highlighting the importance of anticipation and strategic planning. Are you ready to face these challenges together with SOL?


