


- Polkadot’s price chart shows a bullish pattern, signaling a strong rally like in the past.
- On-chain measurements and technical indicators like RSI and MFI show mixed negative and bullish indications.
The cryptocurrency market has noticed that Polkadot (DOT) has been showing consistent but unchanging price behavior in recent days. Expert assessments and emerging patterns point to a developing momentum that may result in a large price rise despite the sideways movement.
Polkadot’s price has slightly fluctuated over the last week, but in the last 24 hours, it has slightly declined, losing more than 1% of its worth. According to the most recent statistics, DOT’s market capitalization is still above $12 billion, with its current trading price of $8.43.
Anticipations of a Bullish Rise on DOT
DOT’s price chart shows a bullish trend, indicating a breakout. FLASH, a popular cryptocurrency expert, tweeted that Polkadot is poised to break its bullish pattern, which has led to significant bull rallies.
All weak hands out now? pic.twitter.com/vRHH6Hddmf
— FLASH (@THEFLASHTRADING) April 10, 2024
The DOT’s performance in February and November of 2023 serves as evidence that similar arrangements led to significant price increases.
According to Polkadot’s past record, when it breaks above such bullish patterns, it usually triggers strong bull rallies, which might pave the way for the price to return to its March highs.
The network’s milestone of having over 605,000 active accounts further emphasizes the growing popularity of the network and points to a thriving and developing ecosystem, in line with what ETHNews previously disclosed. To explore this development in more depth, you can watch the YouTube video below.
Market Indicators and On-chain Metrics
Santiment’s on-chain measurements point to a more nuanced picture despite the bullish tendencies. The fact that DOT’s open interest is still strong typically indicates that the present, unfavorable price trend will continue.
A surprising turn in the high funding rate, however, suggests that a price reversal may be on the horizon.
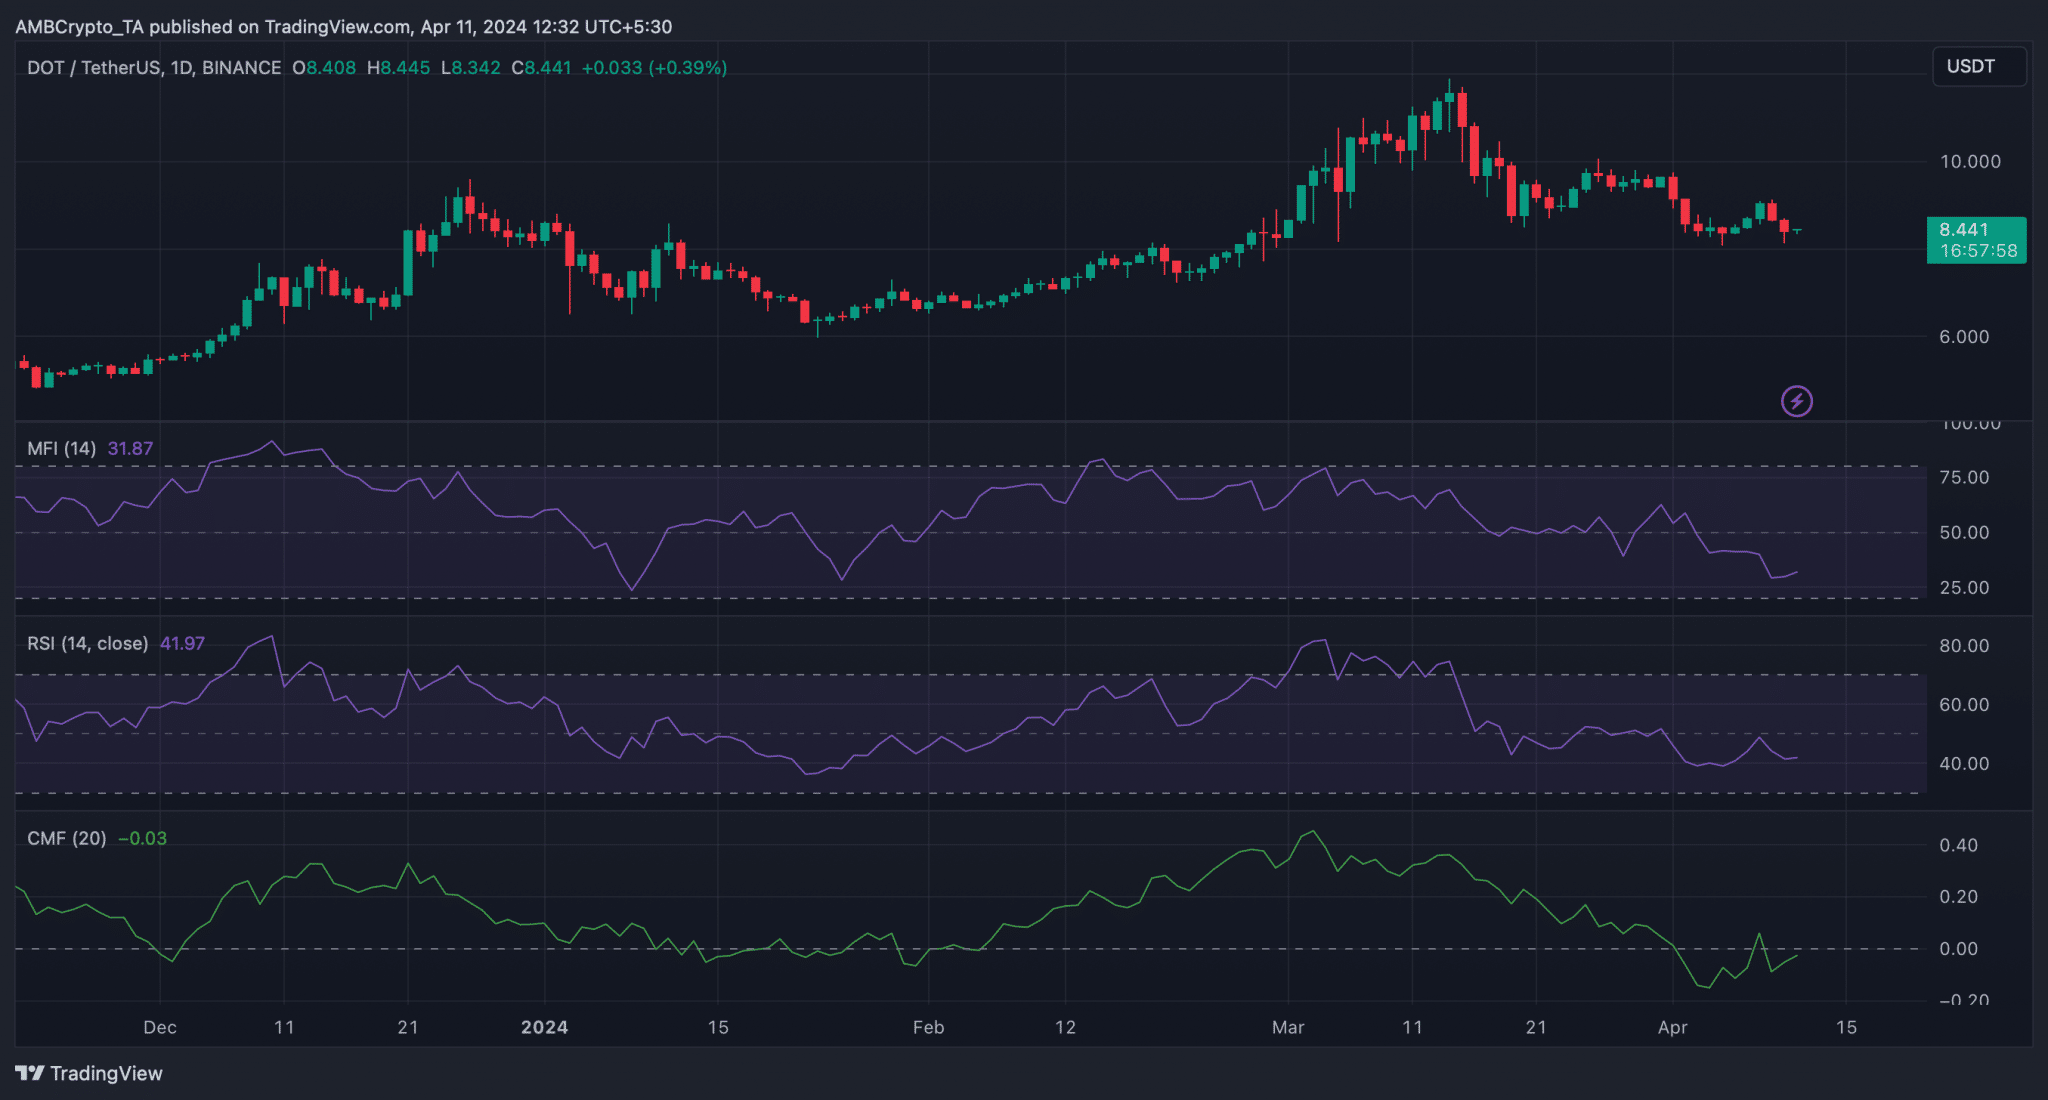
Technical indications help to validate DOT’s positive perspective. While the Relative Strength Index (RSI) is sitting below the neutral mark, suggesting bearish undercurrents, the Chaikin Money Flow (CMF) and Money Flow Index (MFI) have both experienced upticks, suggesting that there may be purchasing pressure ahead of a breakout above the bullish pattern.