- NFT and DeFi sectors on Ethereum suffer, with NFT sales volume down 57% and DeFi TVL down 14%.
- Ethereum’s supply inflation increased, with an addition of over 2,667 ETH in a week, potentially impacting prices.
Recent data from Santiment indicates that Ethereum’s average transaction fee has decreased to $2.34, the lowest level since January. This represents an 84% decrease from the March 5 peak of $15. The reduction in fees corresponds with a decrease in blockchain activity.
Analysis of Network Activity
Ethereum has experienced a decline in network participation. Data from Artemis highlights a 7% reduction in daily unique addresses interacting with Ethereum since March 19, and a 14% reduction in the total number of transactions completed on the network as of April 17. This overall decrease in activity has implications for various sectors dependent on Ethereum.
The downturn in network engagement has particularly affected the NFT and DeFi sectors. According to CryptoSlam, NFT sales volume on Ethereum has dropped by 57% over the last 30 days, totaling $288 million. Furthermore, DefiLlama reports a 14% decrease in the total value locked in Ethereum’s DeFi protocols, now valued at $49 billion.
Impact on Ethereum’s Supply
The reduced activity on the Ethereum network has coincided with an inflationary increase in the supply of Ethereum. In the past week alone, more than 2,667 new ETH have been added to the circulating supply, which could potentially exert downward pressure on the altcoin’s price.
Predictive Indicators and Market Sentiment
The reduction in transaction fees might suggest a potential bottoming out of Ethereum’s price, with possible implications for a future rally. One key metric to watch is the Age Consumed metric, which measures the movement of previously inactive Ethereum coins. A recent uptick in this metric on April 18 suggests that long-held coins are beginning to circulate, which can indicate significant market shifts.
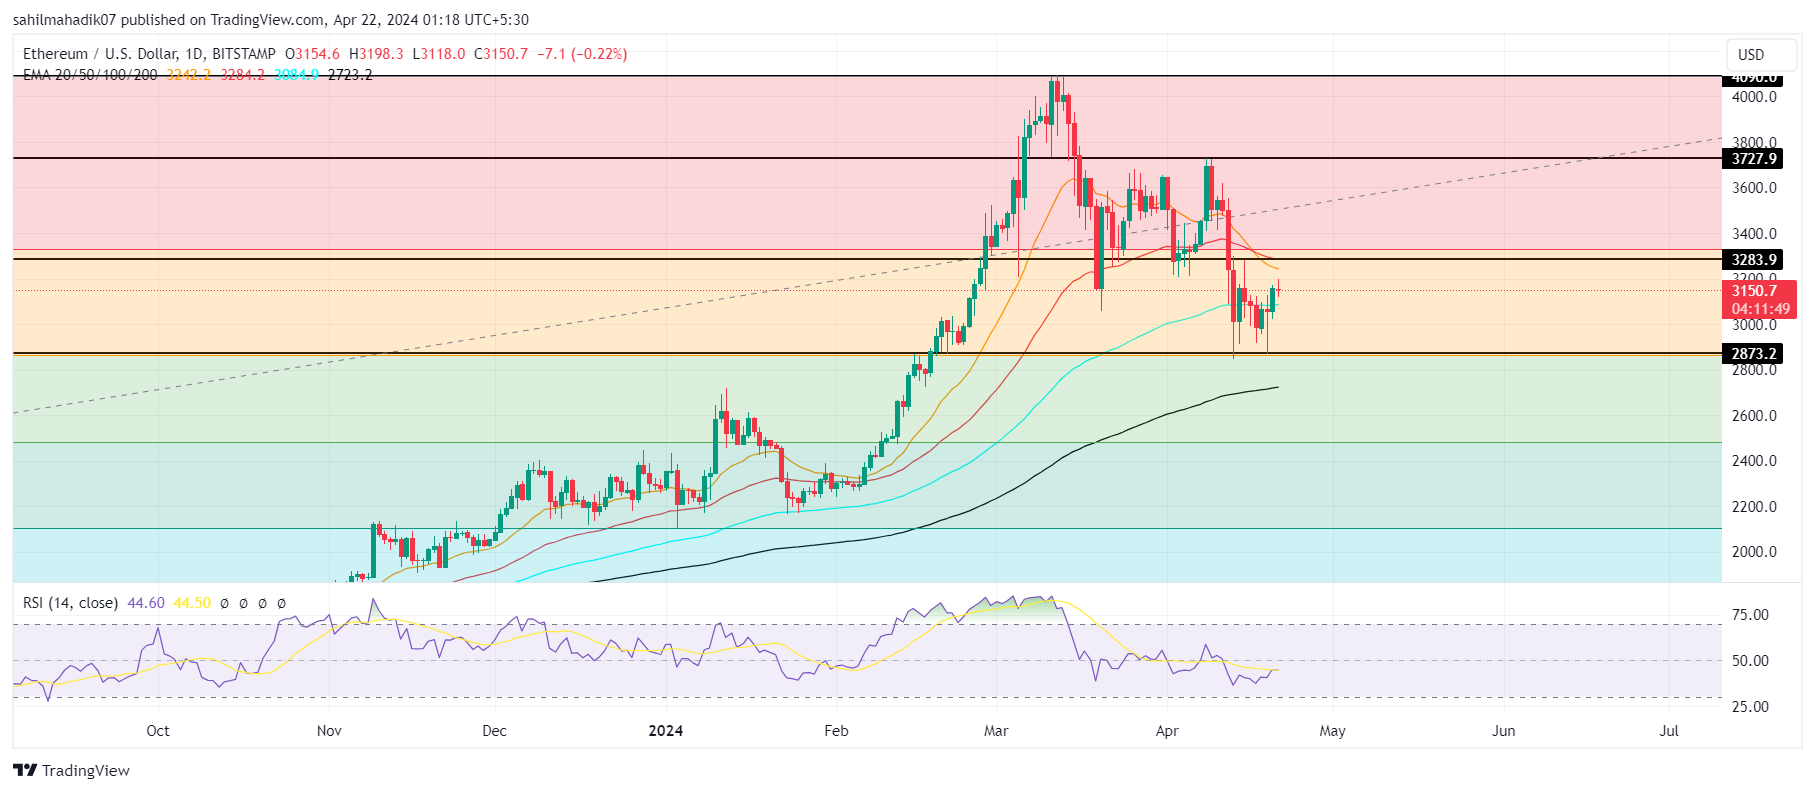
A recent analysis of Ethereum’s 4-hour trading chart revealed a double bottom pattern, a technical formation that typically indicates a reversal from a downward trend to an upward trajectory. This pattern played a role in Ethereum’s price rise to $3198.
On-chain activity also sheds light on Ethereum’s market
Data from Lookonchain showed a significant transaction where an Ethereum whale withdrew 10,119 ETH from Binance. This individual has accumulated a total of 127,388 ETH since April 8, with a current estimated value of roughly $405.19 million. The average buying price of $3,172 per ETH reflects a long-term investment strategy favoring Ethereum’s growth.
This giant whale withdrew 10,119 $ETH($31.85M) from #Binance again 8 hours ago.
He has bought 127,388 $ETH($405.19M) from #DEX and #Binance since Apr 8, with an average buying price of ~$3,172.https://t.co/gV3J2sZdS1 pic.twitter.com/IJ7olISDkw
— Lookonchain (@lookonchain) April 21, 2024
If Ethereum’s bullish trend continues, it could break through the $3300 resistance level. Surpassing this barrier might pave the way for further increases, with potential price targets at $3730 and $4100.

Technical indicators provide additional insights into Ethereum’s market status. Despite a bearish crossover between the 20-day and 50-day Exponential Moving Averages, Ethereum remains above both the 100-day and 200-day EMAs, indicating a potentially bullish long-term trend. The Relative Strength Index, currently at 44%, suggests a market trend that is neutral to slightly bearish.
However, historical data shows that similar increases in the Age Consumed metric have been followed by price declines, suggesting that these were not the beginnings of sustained rallies but rather short-term peaks.
Moreover, the prevailing market sentiment remains bearish, particularly in light of the impending Bitcoin halving event, and this could be influencing Ethereum’s market value.
The current price of Ethereum (ETH-USD) is approximately 3,159.58 USD, experiencing a slight decrease of 1.29 USD or -0.04%.


