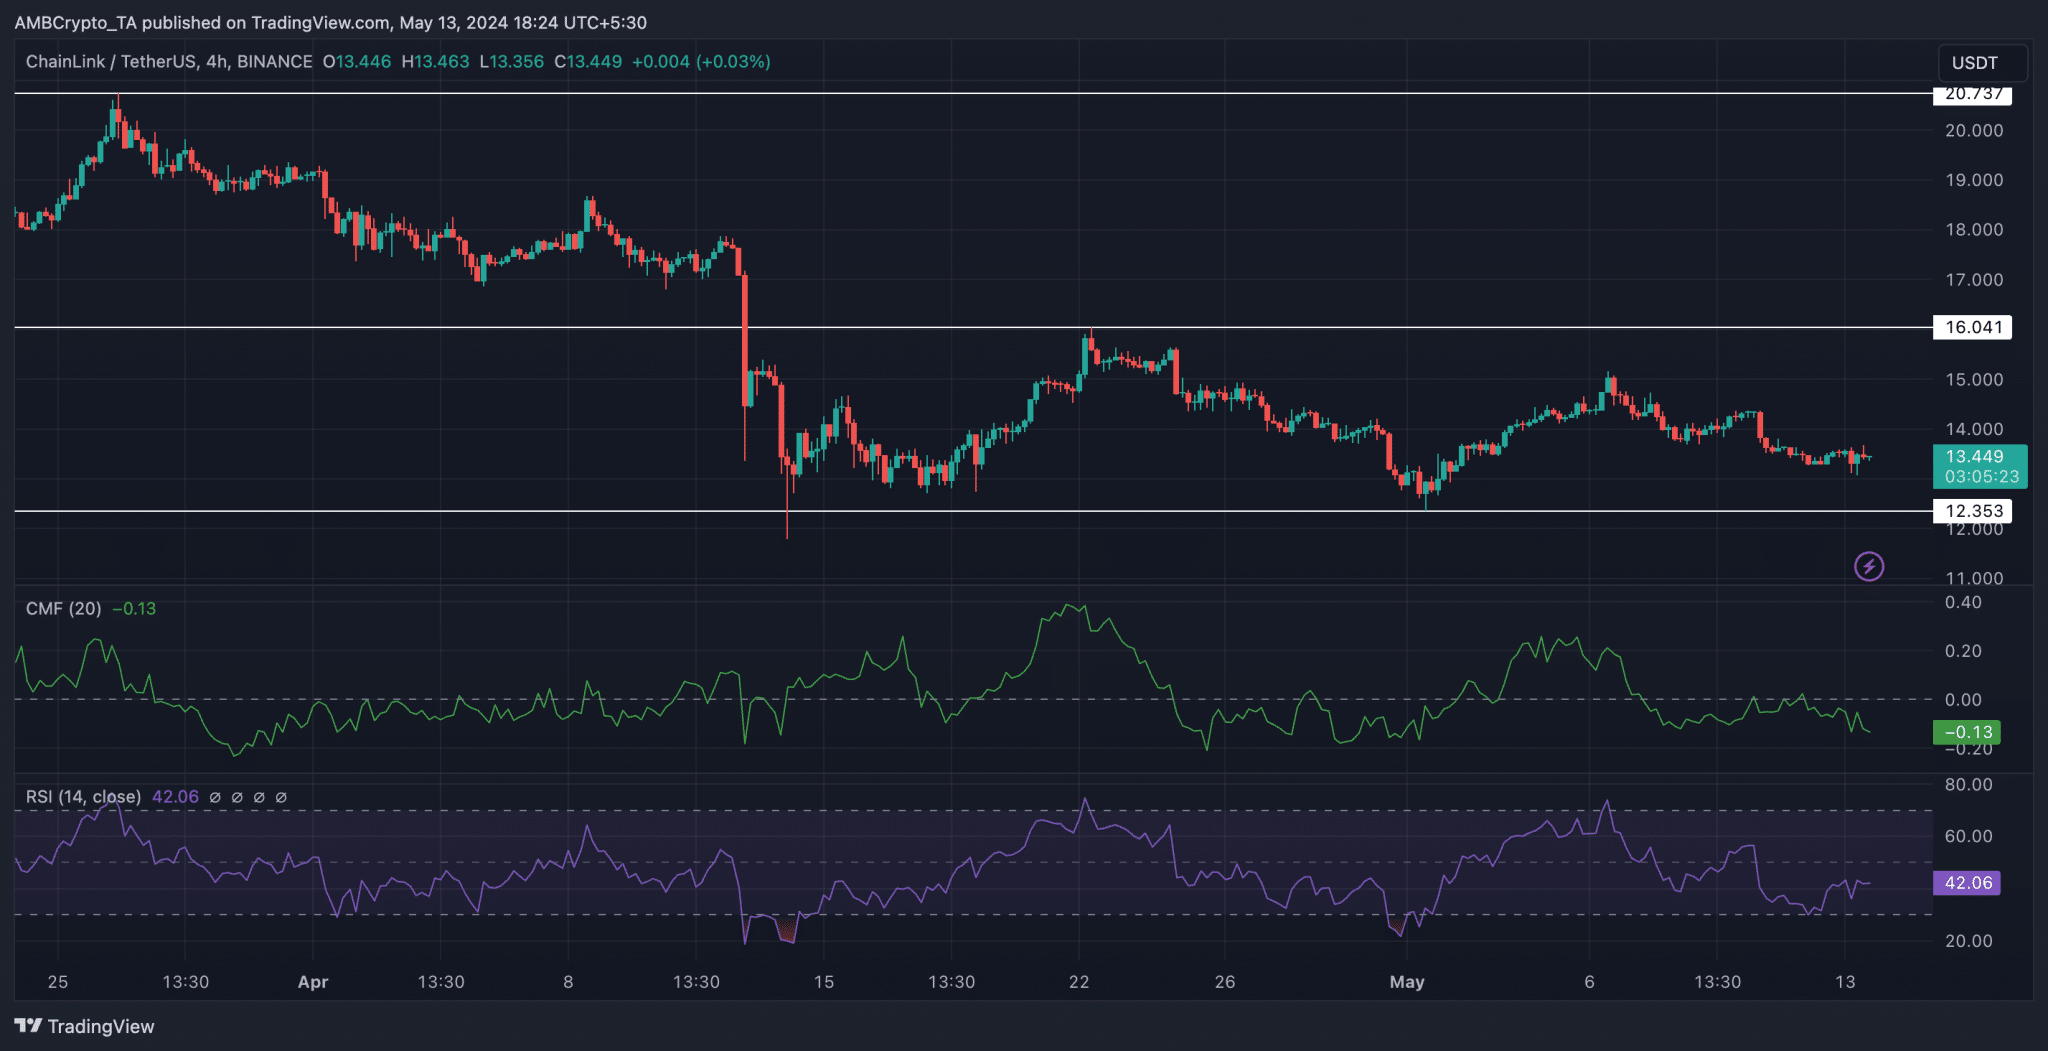
- LINK price struggles to break past $16.041, showing consistent lower lows and highs, indicating a bearish trend.
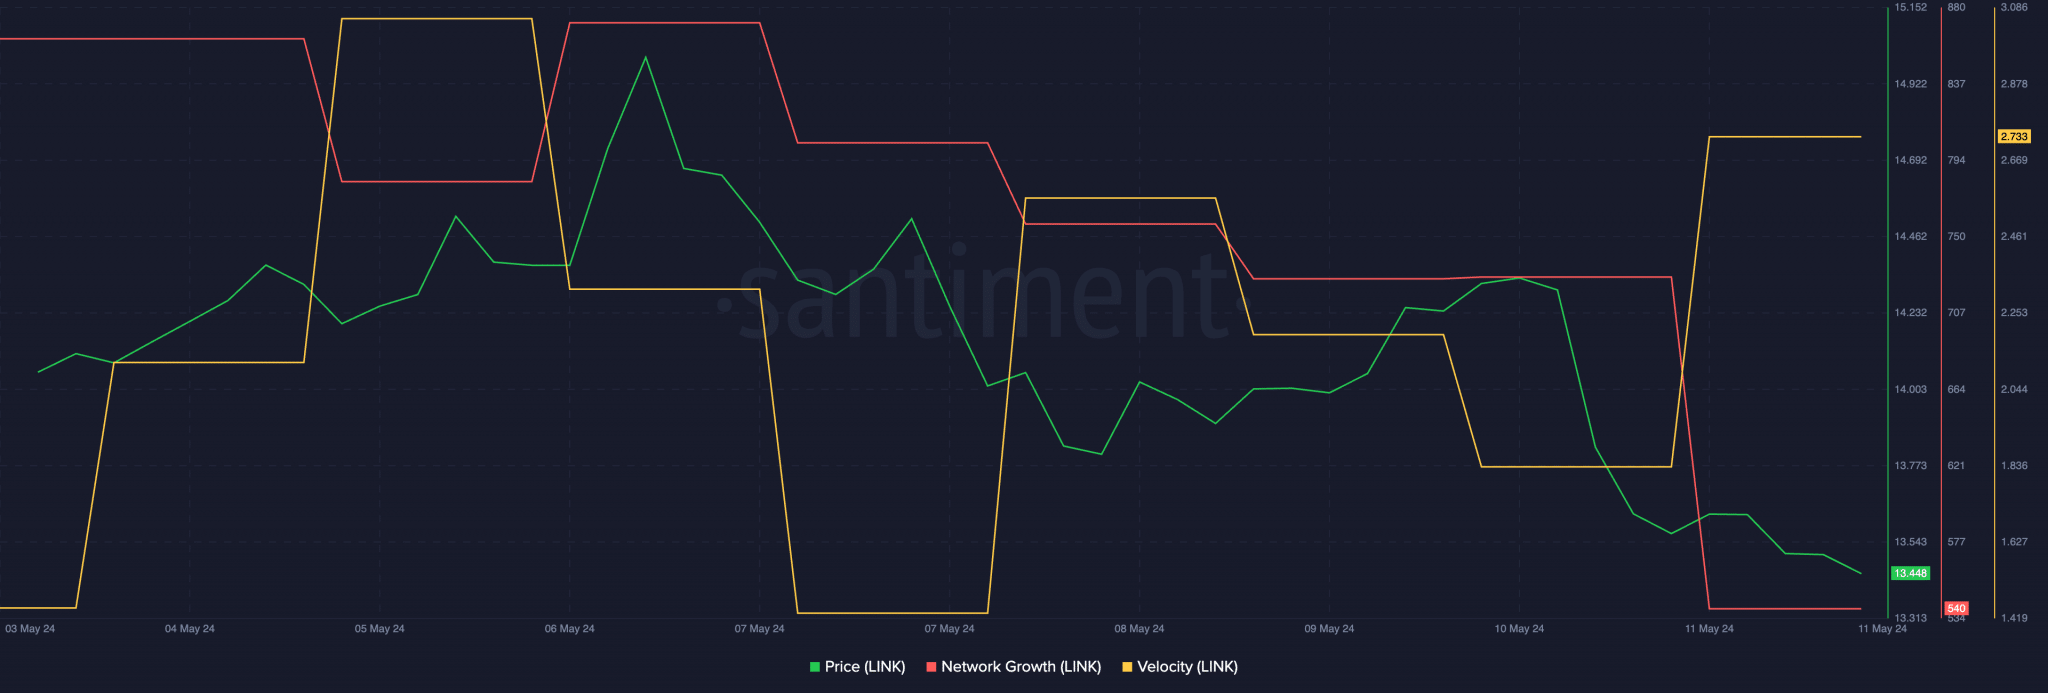
- Despite market challenges, transaction velocity for LINK remains high, suggesting frequent trading activity continues.
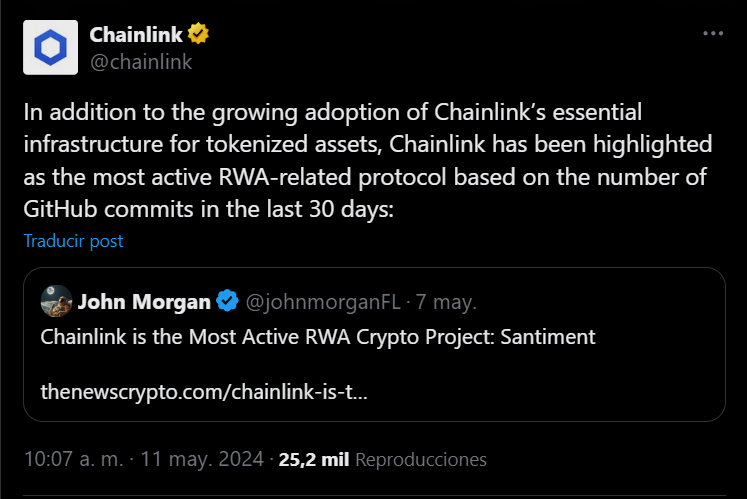
In recent days, Chainlink, has seen an increase in development activities on its network. This uptick in development is notable within the Real World Assets (RWA) sector, placing Chainlink at the peak of GitHub activity.
⬡ Chainlink Adoption Update ⬡
This week, there were 12 integrations of 6 #Chainlink services across 6 different chains: @arbitrum, @avax, @base, @BNBCHAIN, @ethereum, and @0xPolygon.
New integrations include @AbyssWorldHQ, @indexcoop, @lendrnetwork, @LinearFinance,… pic.twitter.com/TasaeGUFTN
— Chainlink (@chainlink) May 12, 2024
This heightened activity indicates a robust commitment to enhancing blockchain solutions for tangible assets.

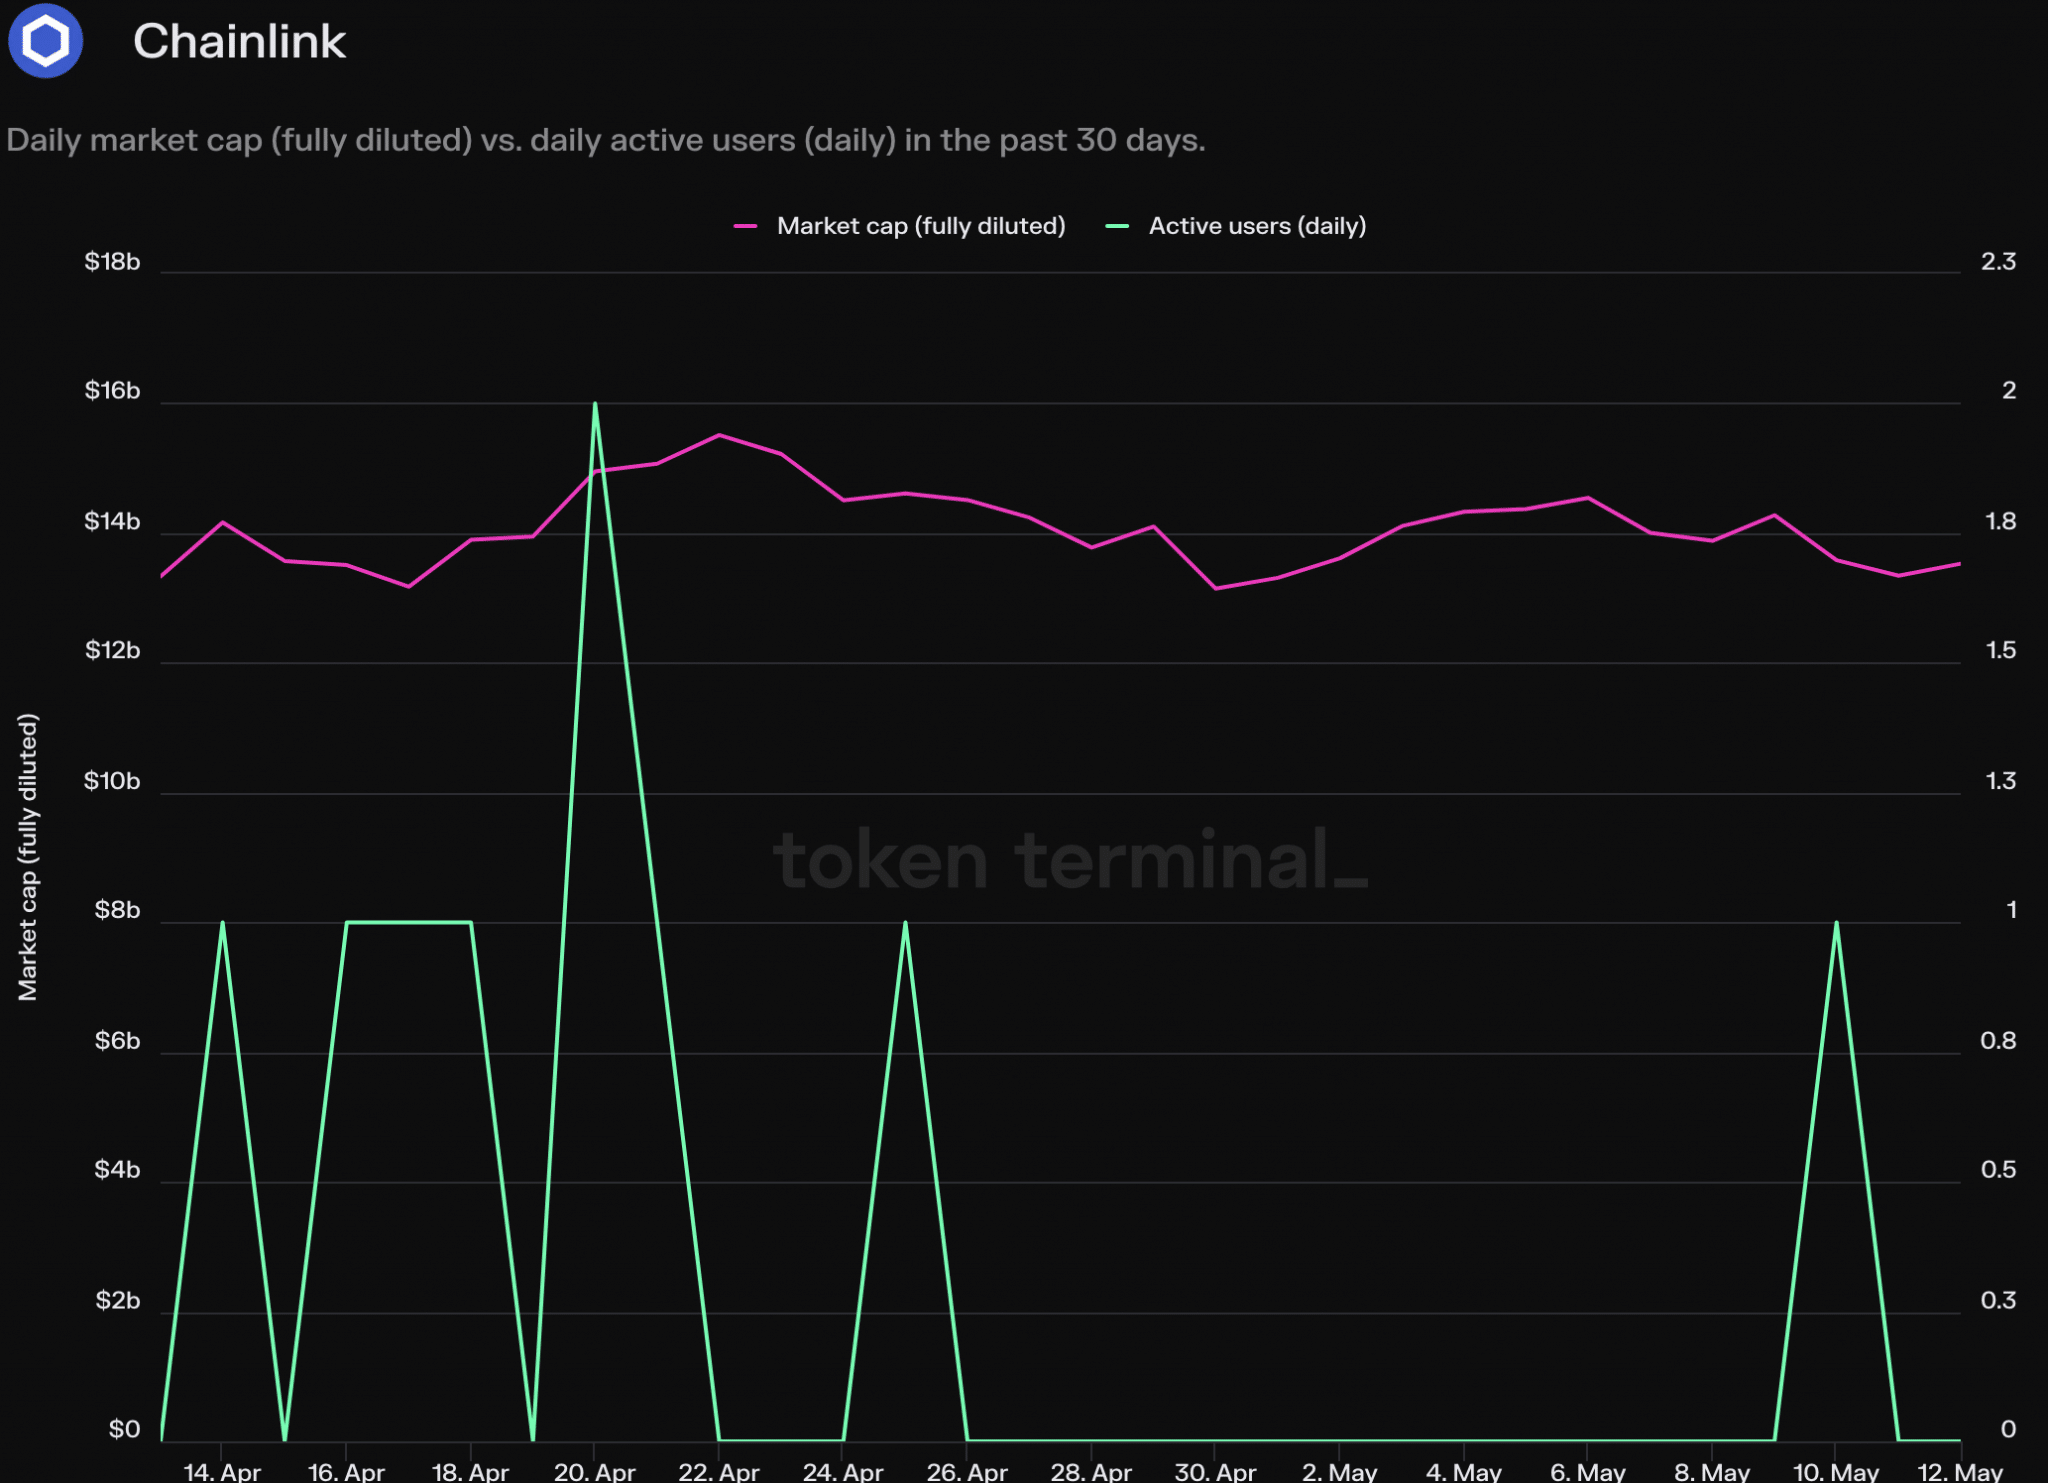
Despite this progress in development, Chainlink has faced a downturn in other areas. Analysis from ETHNews, utilizing data from Token Terminal, shows a sharp 66% decrease in daily active users on the network over the last month. Additionally, the revenue generated by Chainlink has dropped a lot, falling by 90%.

These declines are mirrored in the price of LINK, which has also seen a considerable downturn. Starting from March 26, LINK’s price began to fall from $20.737, displaying a consistent pattern of lower lows and lower highs, a classic indication of a bearish trend in the market.

Through April and May, LINK struggled to surpass the $16.041 level, consistently failing to break this resistance point.
The technical indicators for LINK also reflect challenges
The Chaikin Money Flow (CMF) index has decreased to -0.13, suggesting that the inflow of money into LINK has reduced markedly. Additionally, the Relative Strength Index (RSI) for LINK has dropped to 42.06, further indicating a decrease in bullish momentum for the token.
Furthermore, Chainlink’s network growth has declined, suggesting a decrease in the creation of new addresses and potentially heightening selling pressure on the token.

However, an area of activity that remains high is the velocity of LINK transactions, which has seen a substantial increase, indicating that the frequency of LINK trades remains high despite other negative indicators.
While development activities suggest potential future enhancements and improvements to Chainlink’s offerings, current network and financial metrics reflect a period of difficulty.
This situation presents a mixed outlook for LINK, where developmental strides may eventually help in reversing the negative trends if they successfully translate into broader network usage and improved market sentiment.
Moving forward, Chainlink may need to continue enhancing its platform and offerings to regain and expand user engagement and financial stability.


