- In the face of continuous market instability, BNB is currently trading at $603.68, representing a 4.12% increase in just one day.
- The market strength of BNB Chain is under threat due to a recent fall in trading volume and network activity.
The cryptocurrency market has had substantial swings in recent weeks, with Binance Coin (BNB) attracting much public attention. Binance Coin (BNB) has been trading laterally for some time now, stirring investors’ curiosity by making erratic swings in the market.
BNB Current Price Trends and Analysis
According to the latest data from Coinmarketcap, the price of BNB is now $603.68, up 4.12% over the past 24 hours and 4.74% in a weekly movement.
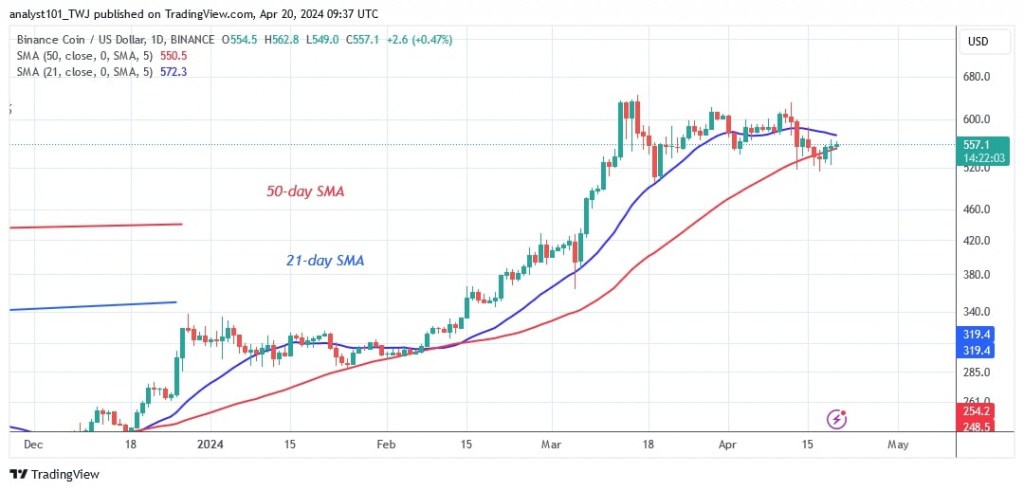
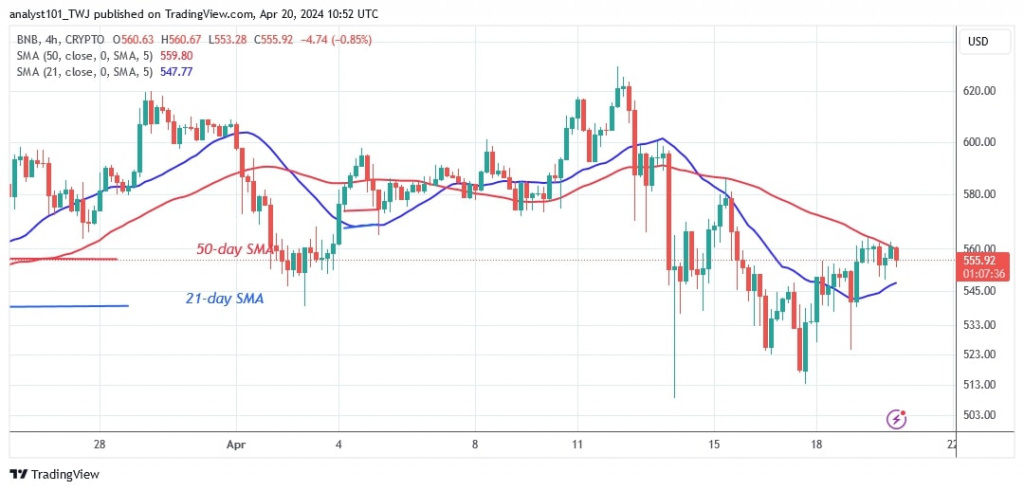
On March 13th of 2024 an up trend suddenly ended, BNB came to stand between $520 and $630. On the trading charts, doji candlesticks which represent investor indecision and a balance of power between buyers and sellers, well describes this kind of price action.

Technical signs indicate that BNB is alternating between levels of major support and resistance. The important resistance levels are $600, $650, and $700, while the $400, $350, and $300 support levels are indicated.
The little doji candlesticks that are present, which are mainly found between the moving average lines, highlight the continued lack of enthusiasm and uncertainty about the direction of the market.

Possible Changes in Price
If the price of BNB breaks over the resistance level of $645, it may spark the uptrend again and target a high of $920. On the other hand, a violation of the $520 support level might lead to a decline to as low as $420, indicating a bearish shift.
Within the BNB Chain ecosystem, there has been a noticeable drop in trading volume and network activity, as evidenced by a vital observation made last week, as previously reported by ETHNews.
Just $62,500 was made on April 15, which begs questions about the BNB market’s underlying health and potential for growth. For a more in-depth look at these developments, find out in this YouTube video.


