


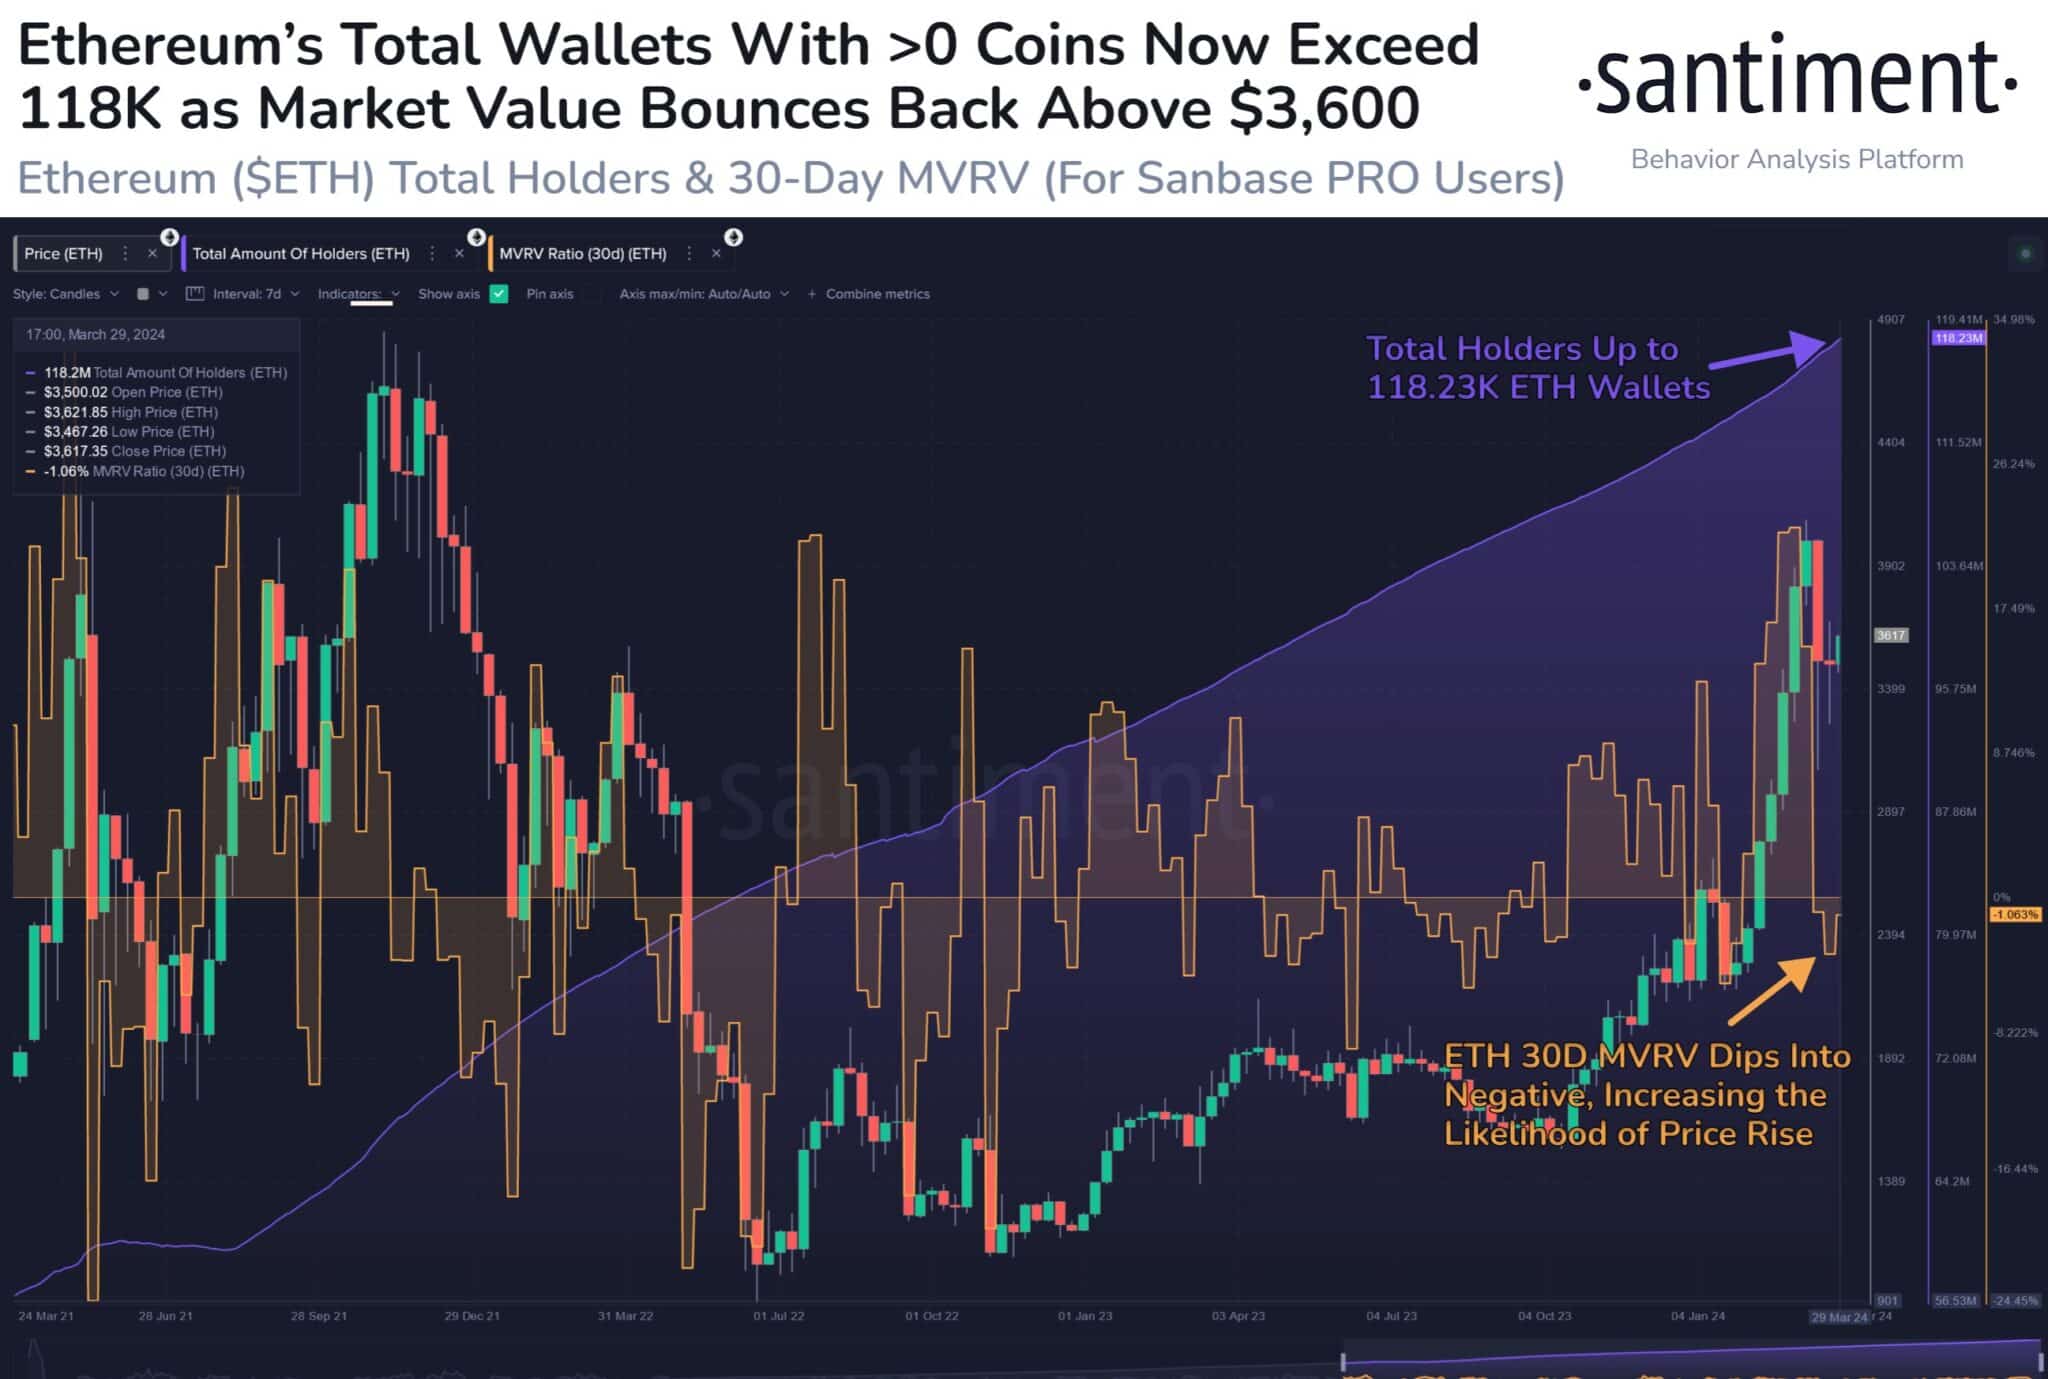
- Ethereum’s positive Ethereum addresses new all-time high, indicating growing investor participation and interest.
- Ethereum recovers from recent declines, trading around $3,615 with a market capitalization of $433 billion.
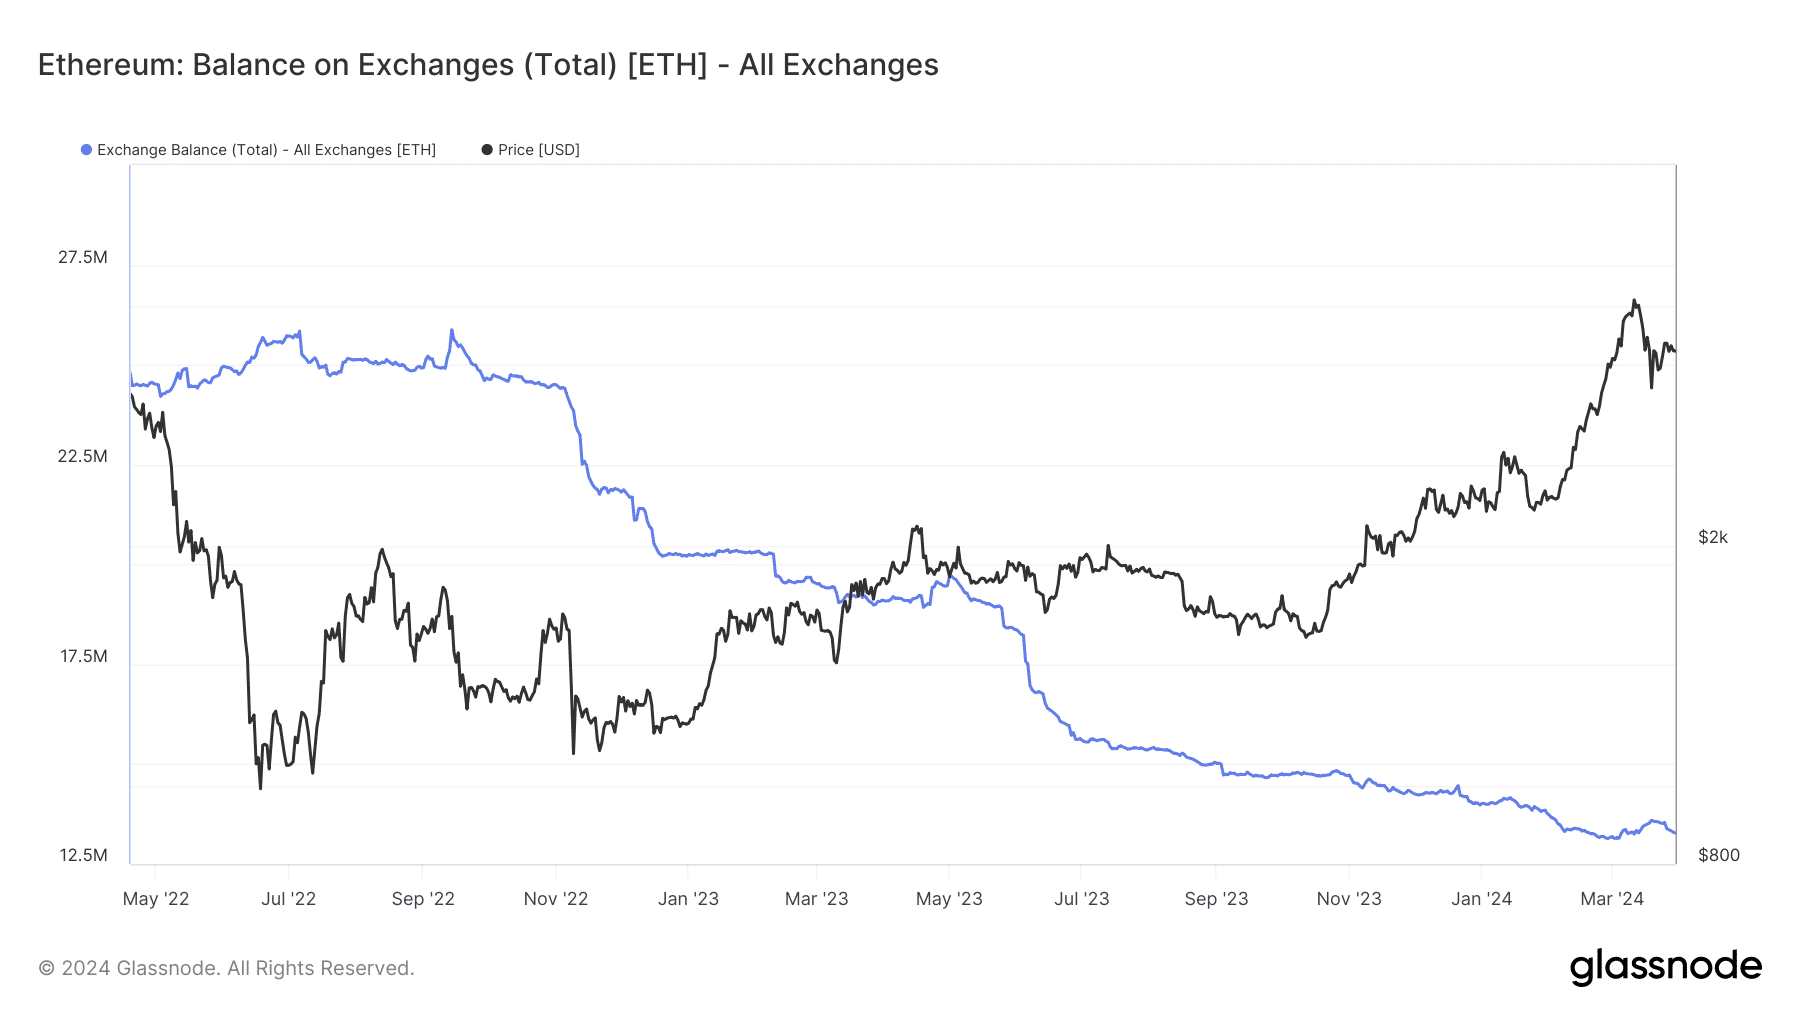
The recent escalation in the number of Ethereum (ETH) accounts holding an active balance, setting unprecedented records, coupled with a notable reduction in available ETH on exchange platforms, bodes well for its future valuation.
With Ethereum overcoming market adversity by surpassing the $3,000 barrier the previous month and positioning itself around $3,615 today, such elements highlight an increase in interest and investment by the community
The fact that Ethereum’s positive-balancing addresses have reached a new record high indicates increased investor participation and could be interpreted as a sign of a strengthening market. This, combined with the subtly bullish signal shown by the medium-term MVRV ratio, suggests positive market sentiment towards Ethereum.
Related: Ethereum rises 13%; Dogecoin’s new rival gaining popularity
In addition, the reduction in the percentage of total Ethereum supply available for active trading, from 15.8% last year to approximately 11% currently, points to a decrease in selling pressure and could intensify supply shortages in the market. This trend of diminishing supply, especially if it continues, could put upward pressure on the price of ETH.
In this scenario, and taking into account the 57% growth in the price of ETH from the beginning of the year until now, it is contemplated that its value will continue to rise, aiming towards the $4,000 target.
Such developments suggest a possible bullish market for Ethereum, in which the limited availability of the coin and increased investment activity could be determining factors for the next rise in ETH’s value.
You can read: Ethereum’s Buterin reflects on the future of Memecoins: Beyond Shiba Inu, FLOKI, WIF and BONK
ETH Analysis
Ethereum’s (ETH-USD) current price is approximately $3,523.30 USD. It has experienced a decrease of $107.91, which represents a drop of about 2.97% since it was last recorded.
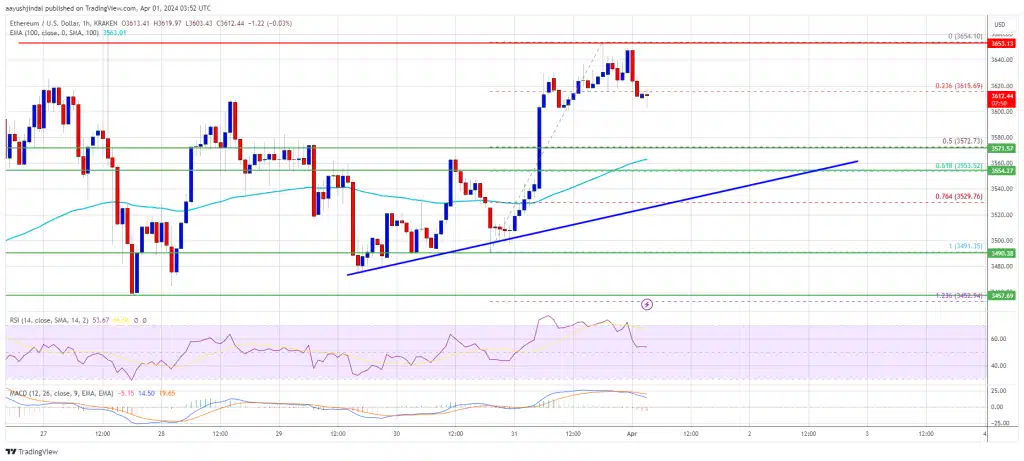
Indicators include EMA (Exponential Moving Average), RSI (Relative Strength Index) and MACD (Moving Average Convergence Divergence). The EMA suggests a recent uptrend, the RSI is in the neutral zone tending to overbought, and the MACD histogram shows declining bullish momentum.
Fibonacci levels highlight possible support or resistance. The confluence between these could indicate entry or exit points.
In trading, you must always be prepared for the best and the worst!
The most brutal scenario for #Ethereum right now is breaching the $3,400 support level. Such a move could confirm a bear pennant formation on the daily chart, potentially triggering a major correction for $ETH… pic.twitter.com/LIXyuz8NlI
— Ali (@ali_charts) April 1, 2024
This analysis makes more sense, when we look at Analyst Ali MArtinez’s tweet, he comments on the existence of a challenging scenario for Ethereum at the moment. Itmay break the $3,400 support level. This would signal a bearish pennant on the daily chart, which would trigger a major correction for $ETH to $2,800.


