- Despite the price drop, bullish sentiment and strong social support suggest optimism for DOGE.
- Technical indicators show possible upside, although overvaluation and the drop in network activity indicate correction risks.
Analysis of the current context of Dogecoin (DOGE) reveals a complex situation with signs of optimism despite a recent drop in its market value. Although DOGE experienced a decline in its price, standing at $0.08174 with a market cap that places it in 11th position among cryptocurrencies, sentiment around the coin has veered towards optimism.

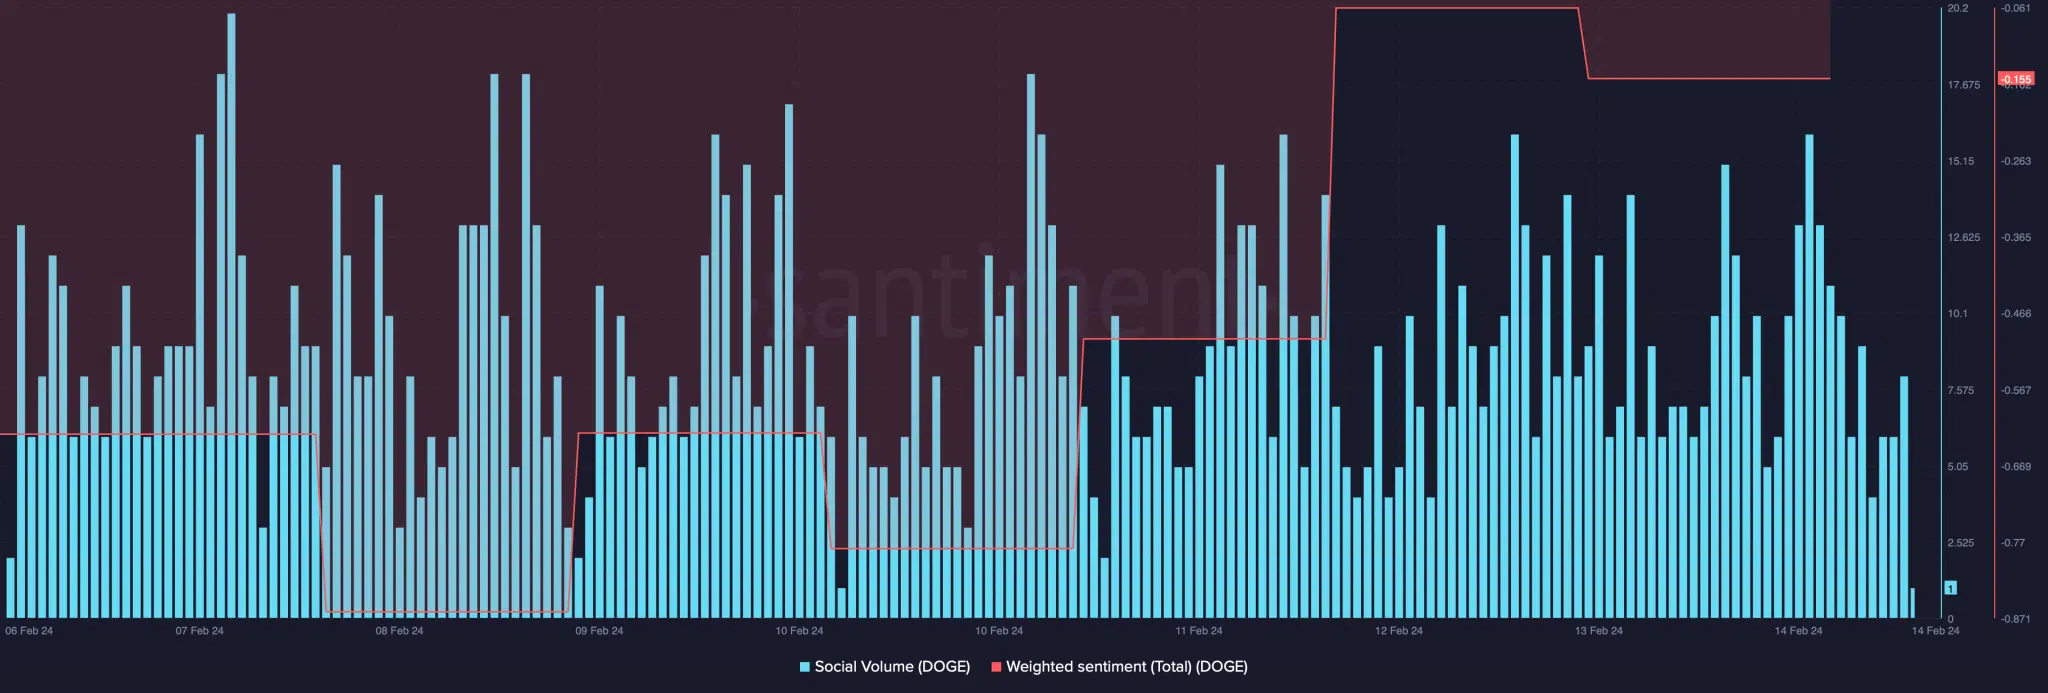
This shift in perception, evidenced by an increase in social activity and more bullish weighted sentiment, suggests that the community maintains robust faith in DOGE’s potential.
⚡️TOP #MEME Tokens by Social Activity $DOGE $SHIB $BONK $PEPE $PNDC $FLOKI #BABYDOGE $BYTE $MARVIN $YOOSHI pic.twitter.com/wmmSEKJEEj
— 🇺🇦 CryptoDep #StandWithUkraine 🇺🇦 (@Crypto_Dep) February 13, 2024
DOGE’s ranking as the most socially active meme currency reinforces this notion of community support, which could act as a counterbalance to adverse market trends.
Price correction risks in the face of mixed technical indicators:
The increase in the NVT ratio on February 13 suggests that DOGE may be overvalued, which would normally indicate a likelihood of a price correction. In addition, the drop in network activity, reflected by a decrease in daily active addresses, could be interpreted as a sign of declining usage and interest in DOGE.

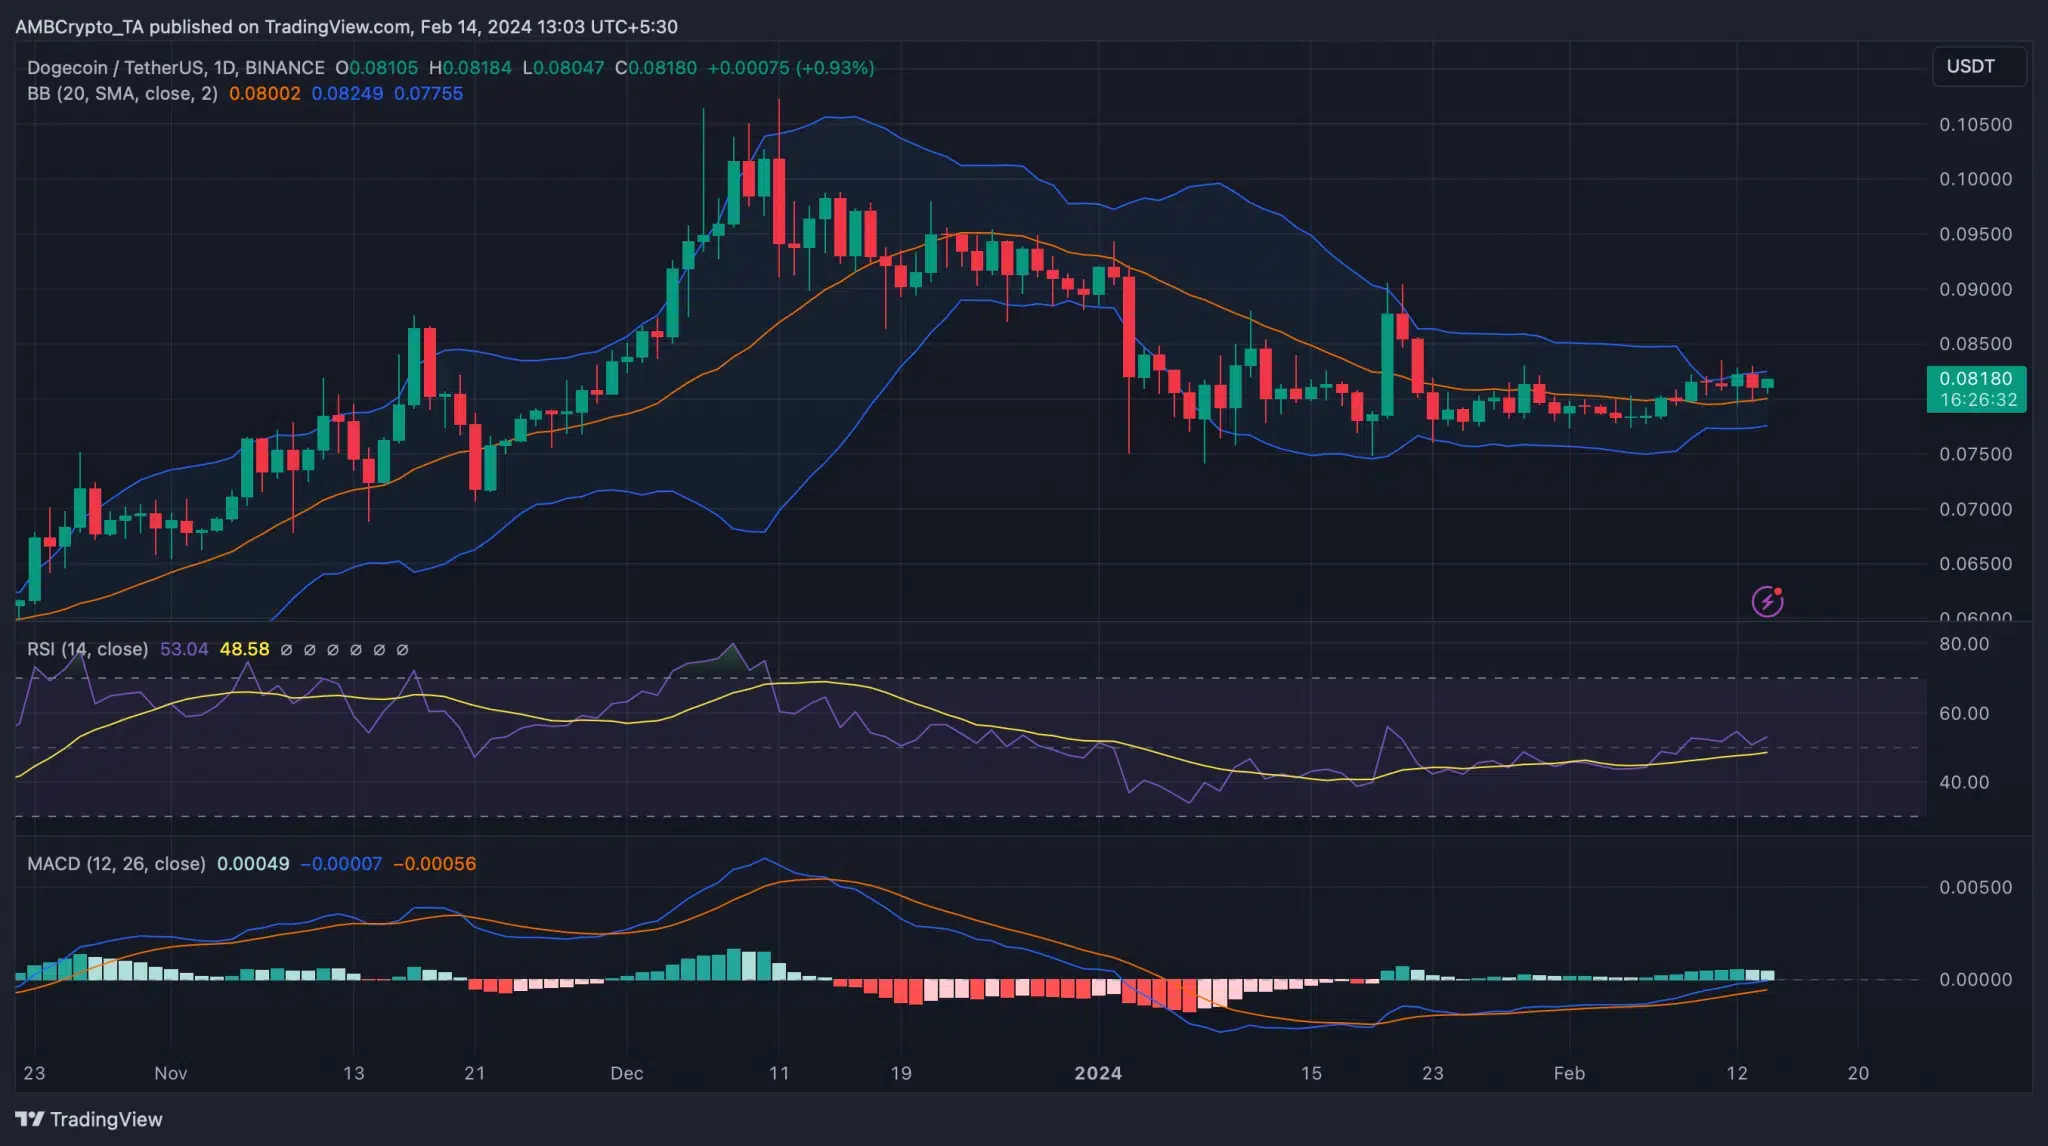
However, the existence of a strong support level at $0.079 offers a glimmer of hope to avoid a steeper decline. If a reversal occurs, DOGE could face resistance at $0.083, but technical indicators such as MACD and RSI suggest a bullish edge and a possible upside in price, respectively.

The key for DOGE will lie in maintaining community support as it navigates these choppy waters, with the hope that favorable technical indicators will translate into positive price momentum .
In the short term, DOGE could experience slow moving days, as suggested by the Bollinger Bands, but the current support and resistance structure provides a framework to anticipate possible price directions.


