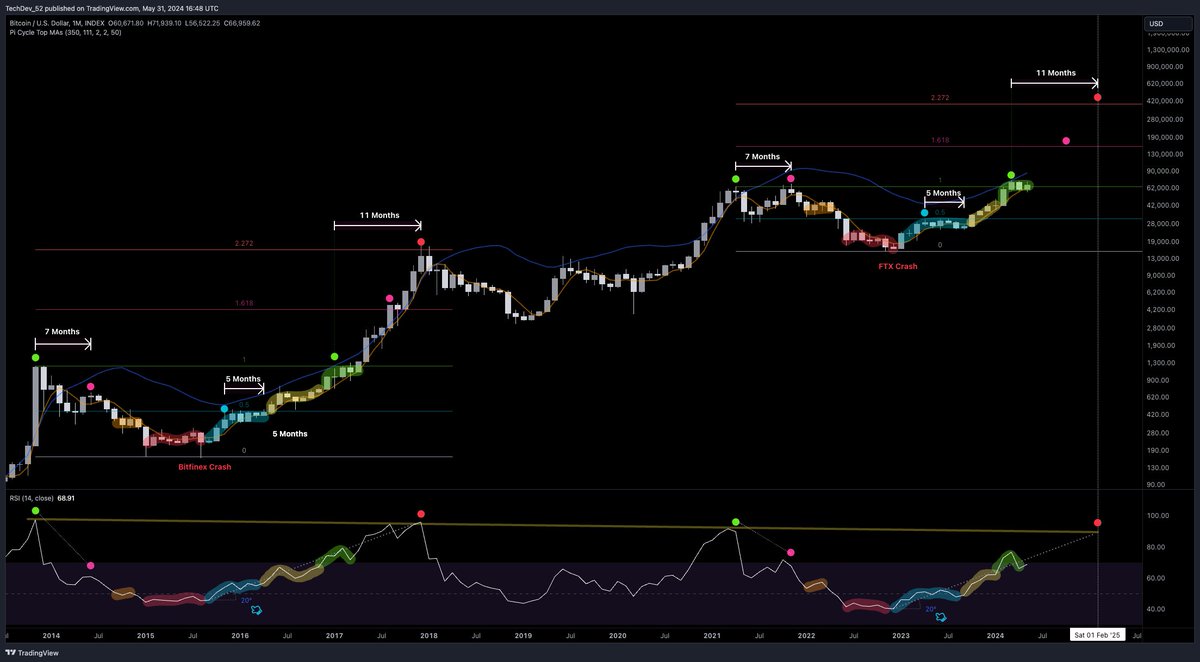
- TechDev notes Bitcoin’s first breakout against M1 money supply since 2017, predicting significant gains.
- As of writing, Bitcoin is priced at $67,716.19, up 0.27% in 24 hours, but down 2.37% over seven days.
A well-watched cryptocurrency analyst has brought attention to a noteworthy Bitcoin (BTC) signal that is similar to the pre-rally indications observed in the 2017 bull market.
The 452,600-follower pseudonymous analyst TechDev on X pointed out that the monthly Bitcoin against M1 money supply chart has broken over the exponential moving average Bollinger Bands’ resistance.
TechDev reports that a comparable incident happened early in 2017, resulting in Bitcoin gains of more than 2,600% in less than a year.
“You’re looking at the first breakout of Bitcoin against M1 money supply since March 2017, when it went historically parabolic for nine months,” he said.
You're looking at the first breakout of #Bitcoin against M1 money supply since March 2017 when it went historically parabolic for 9 months. pic.twitter.com/KMf73COvNh
— TechDev (@TechDev_52) May 31, 2024
Understanding the M1 Money Supply
Comprising all actual money, demand deposits, traveler’s checks, and other checkable deposits, the M1 money supply measures the liquidity in the US financial system. The larger economic background in which Bitcoin functions is made easier to grasp by this assessment.
TechDev thinks this indication suggests that, during the present market cycle, investors and traders may be underestimating the upside potential of Bitcoin. He said:
“Comparisons and trend projections involving 2021 may end up dramatically underestimating things.”
increased money supply in 2021 drove Bitcoin to new USD highs. It arrived there on its own initiative in 2024 and therefore broke out against M1. Once we factor in the expected M1 growth, we probably see BTC surpass projections, which are partly based on 2021.
BTC Price Update and Market Data
Bitcoin is now worth about $67,716.19, up 0.27% in the last day. But during the last seven days, CoinMarketCap data shows, it has been trending bearish, down 2.37%.
According to TechDev, if Bitcoin adopts the trend of the 2017 bull market, it may reach above $400,000 in less than a year. “I know it’s ridiculous,” he said. Not my call. In a year, $70,000 > $420,000 sounds absurd, much as $1,0000 > $20,000 did. I never would have given that a call either.

Meanwhile, at the end of May, ETHNews reported a noteworthy net inflow of $48.706 million into spot Bitcoin ETFs—13 days in a row.


