


- A recent spike in the Dormancy Z-score in April 2024 indicates an increased selling of older coins.
- Despite potential market tops, increased activity from miners may bolster Bitcoin’s price in the near future.
Bitcoin’s market behavior is currently under scrutiny, as on-chain metrics suggest a potential peak in its price cycle, similar to patterns observed in previous years.
Recent data by ETHNews, shows a slight decline in Bitcoin’s value, with a 1.1% drop over the last week and a more pronounced 2.7% decrease in the past 24 hours, bringing its value down to $60,929.
Charles Edwards, the founder of Capriole Investments, has pointed to several on-chain indicators that might suggest a weakening of Bitcoin’s market strength. One key metric being watched is the Long-Term Holder (LTH) inflation rate.
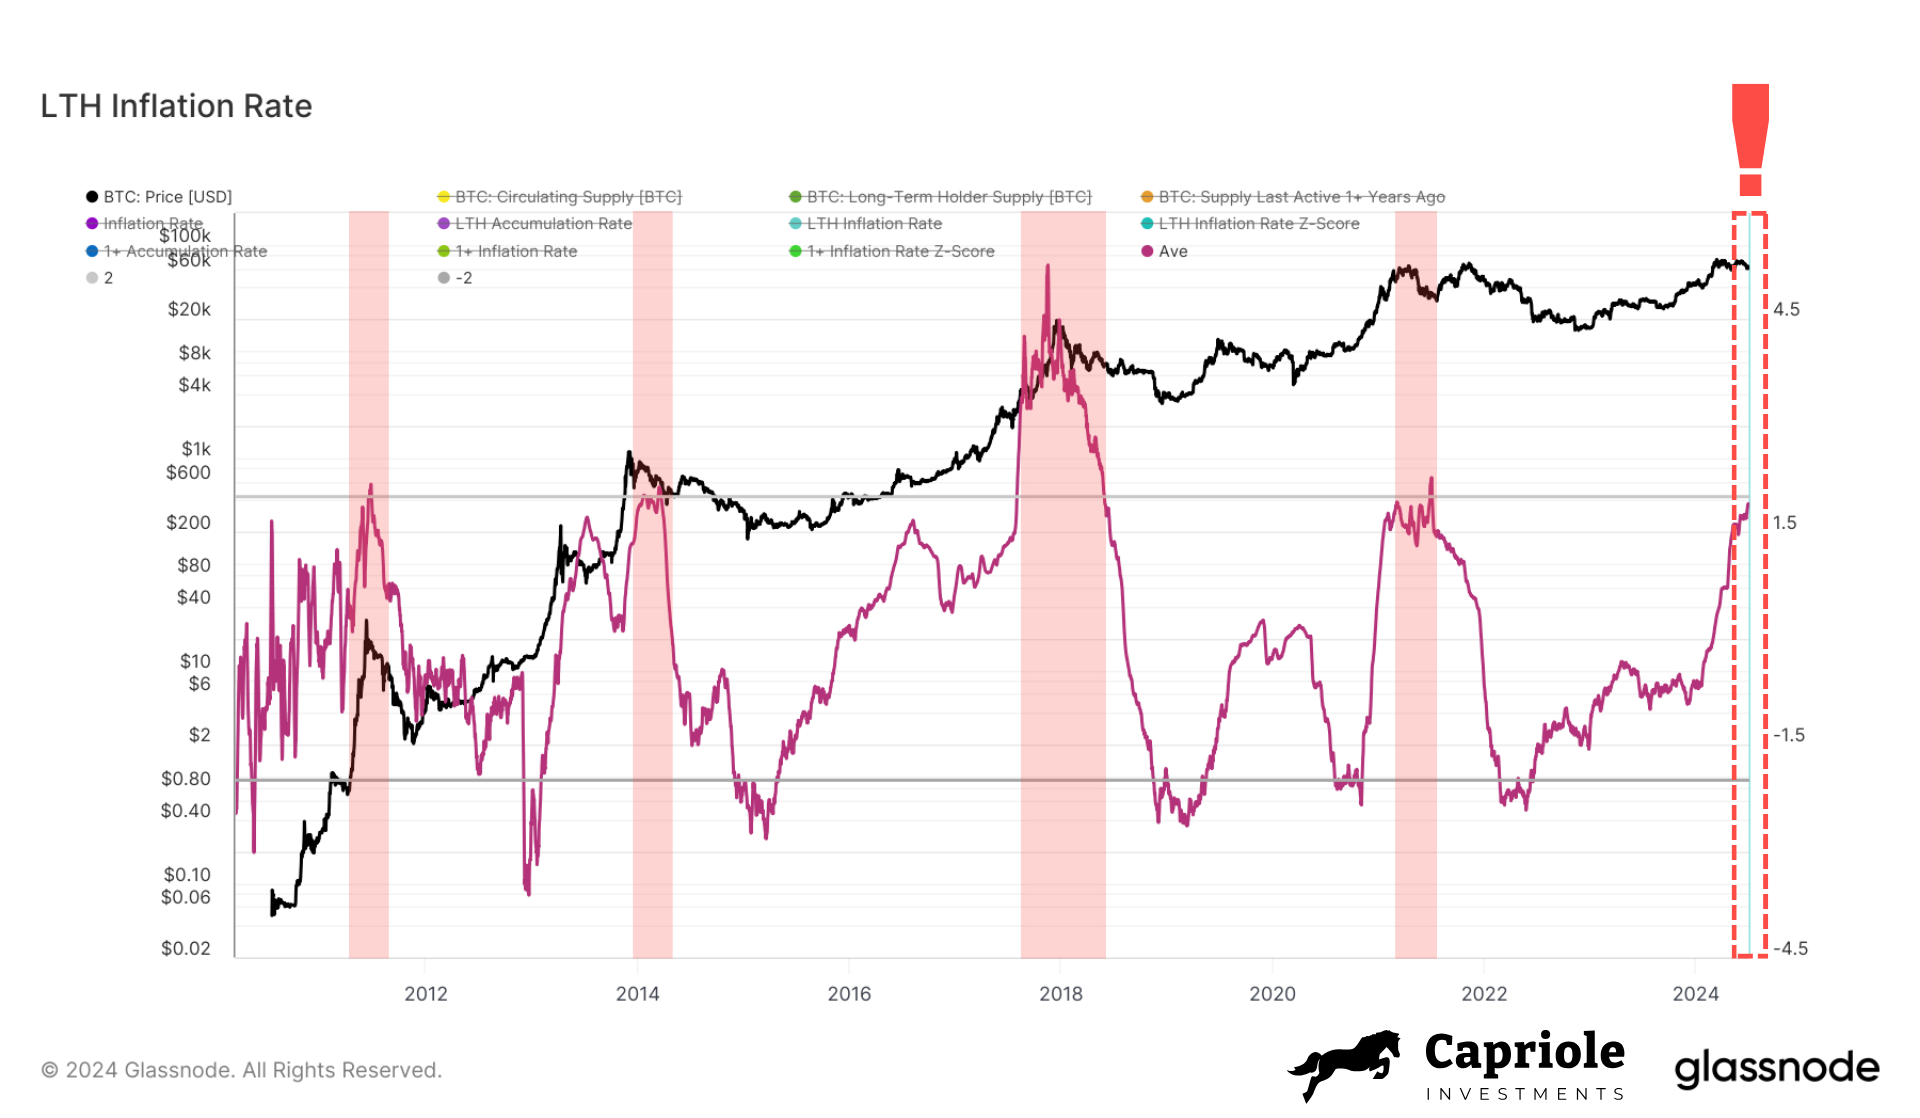
This rate, tracked by Glassnode, measures the annualized rate at which long-term holders sell their Bitcoin relative to newly mined coins. Currently, it is approaching a rate historically linked to cycle peaks, now nearing the 2.0 nominal inflation rate, standing at 1.9.
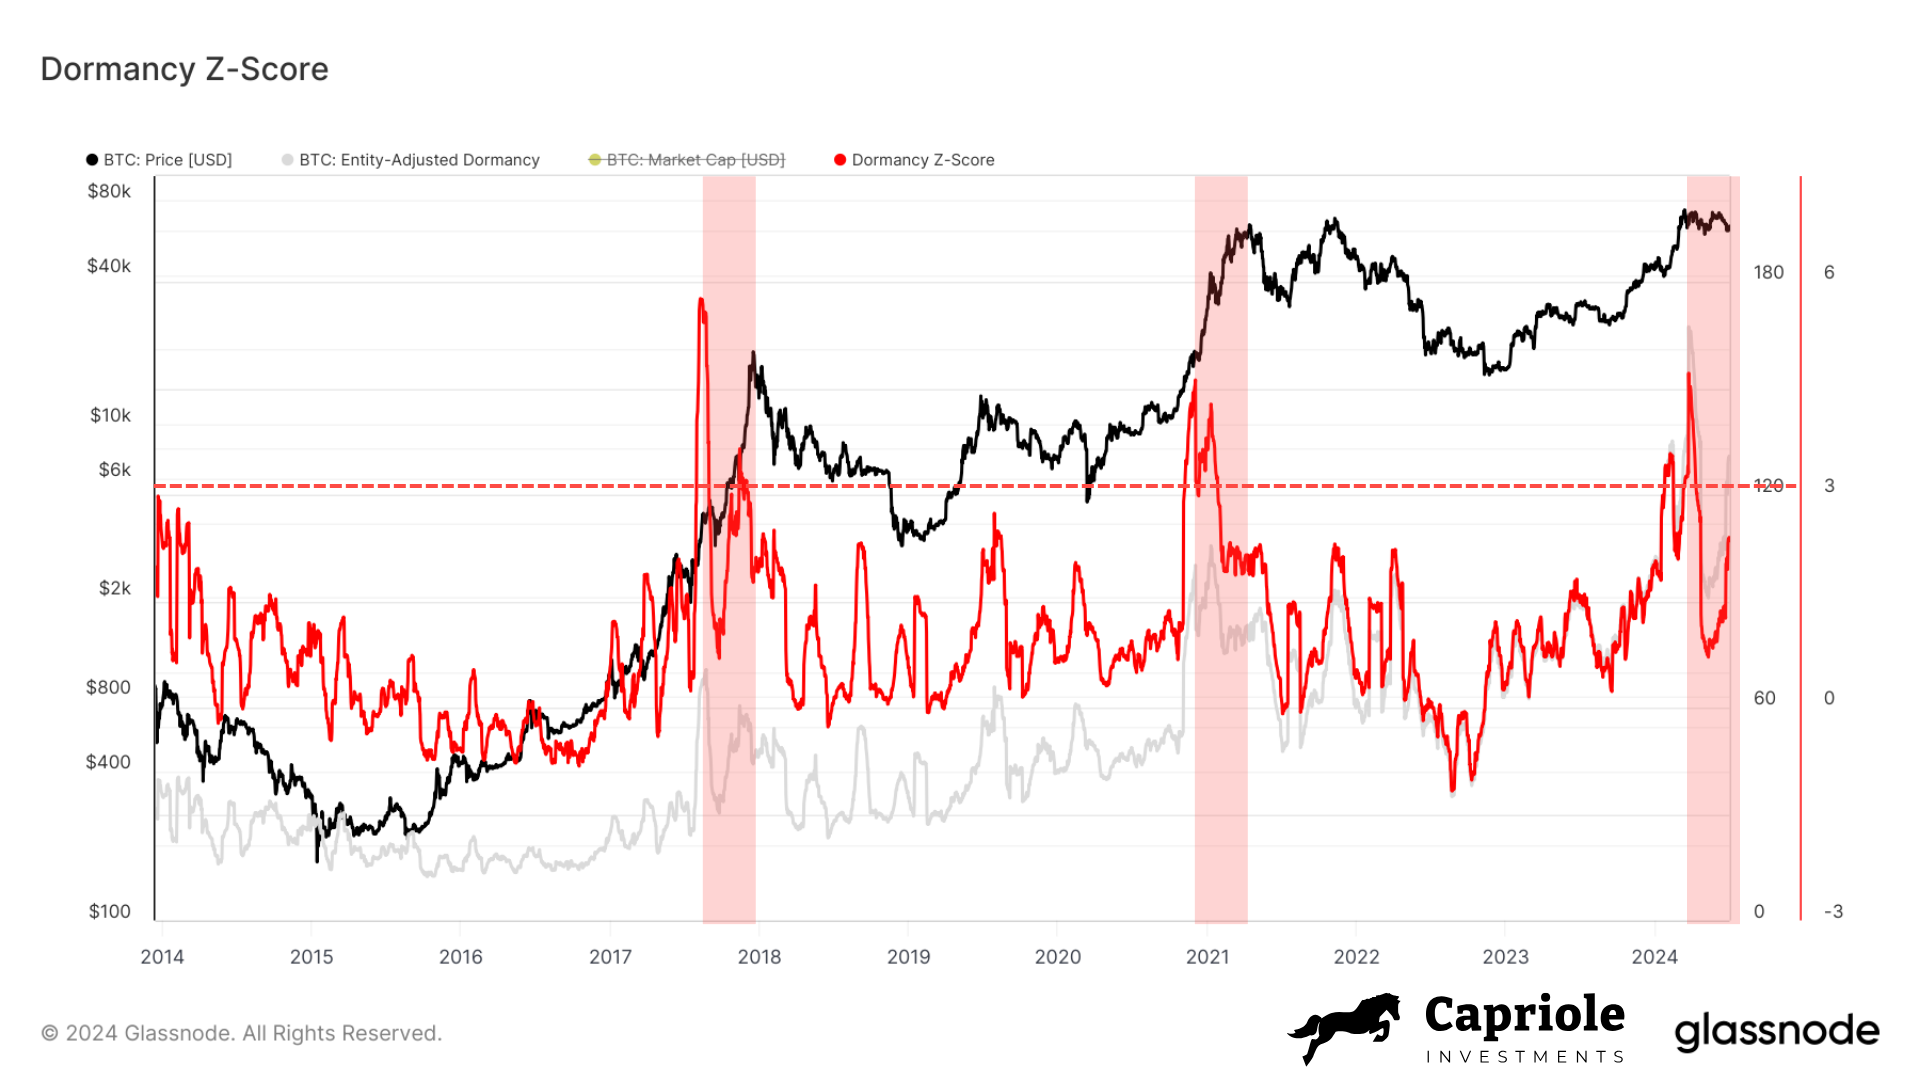
Another metric by ETHNews is the Dormancy Flow, which assesses the value of spent coins relative to their age and the overall transaction volume. A recent increase in the Dormancy Z-score in April 2024 suggests that older coins are being sold at a rate indicating a cycle peak might be imminent.
“Peaks in this metric (z-score) typically see cycle tops just three months later. Well, it’s now three months later. The price has only gone down, and the Dormancy Z-Score peak remains with a structure very comparable to the 2017 and 2021 tops.”
Peaks in this metric typically precede actual market tops by about three months—a pattern that aligns with the observed drop in Bitcoin’s price.
Furthermore, the Spent Volume of coins aged between 7 to 10 years has seen a notable rise this year, suggesting increased market risk and potentially marking the cycle’s peak.
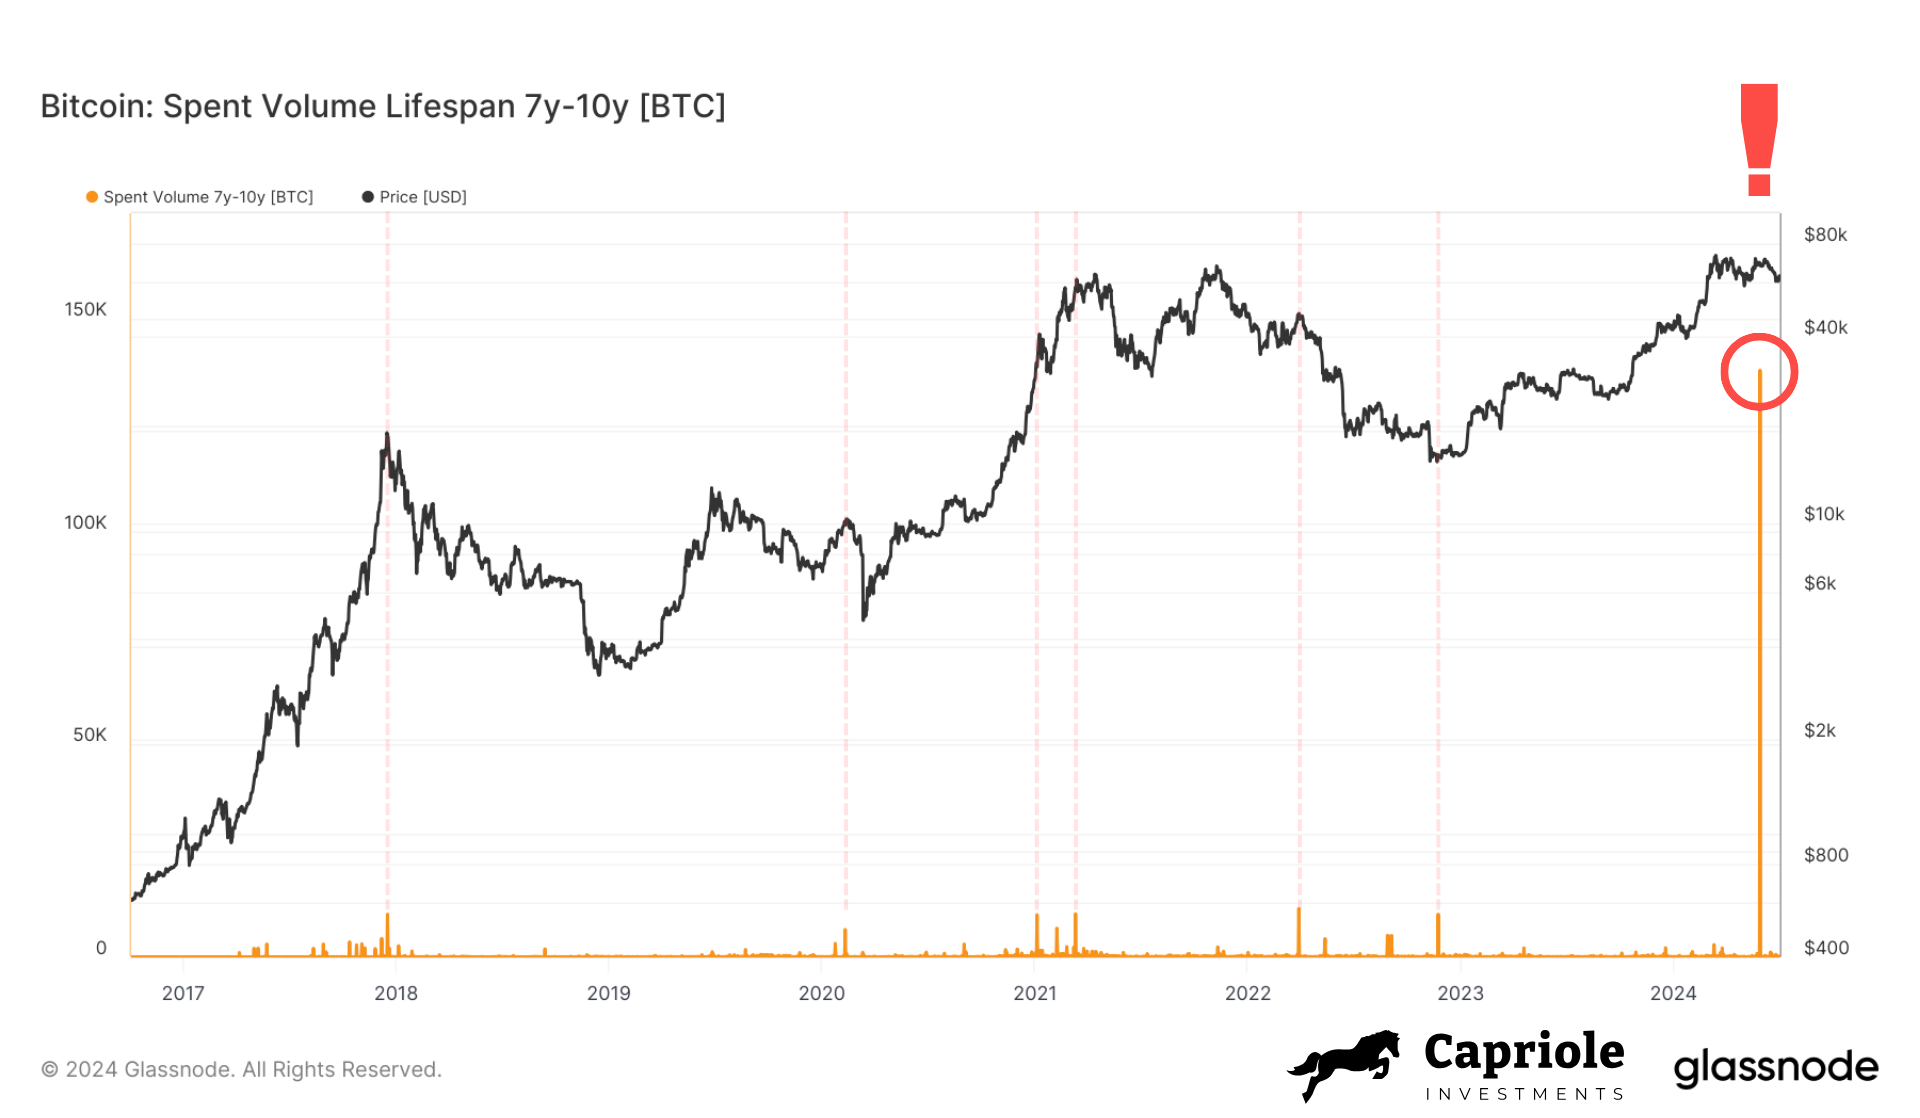
In a movement, over $9 billion worth of Bitcoin from accounts dormant for over a decade has been activated, largely due to transactions related to the defunct Mt. Gox exchange.
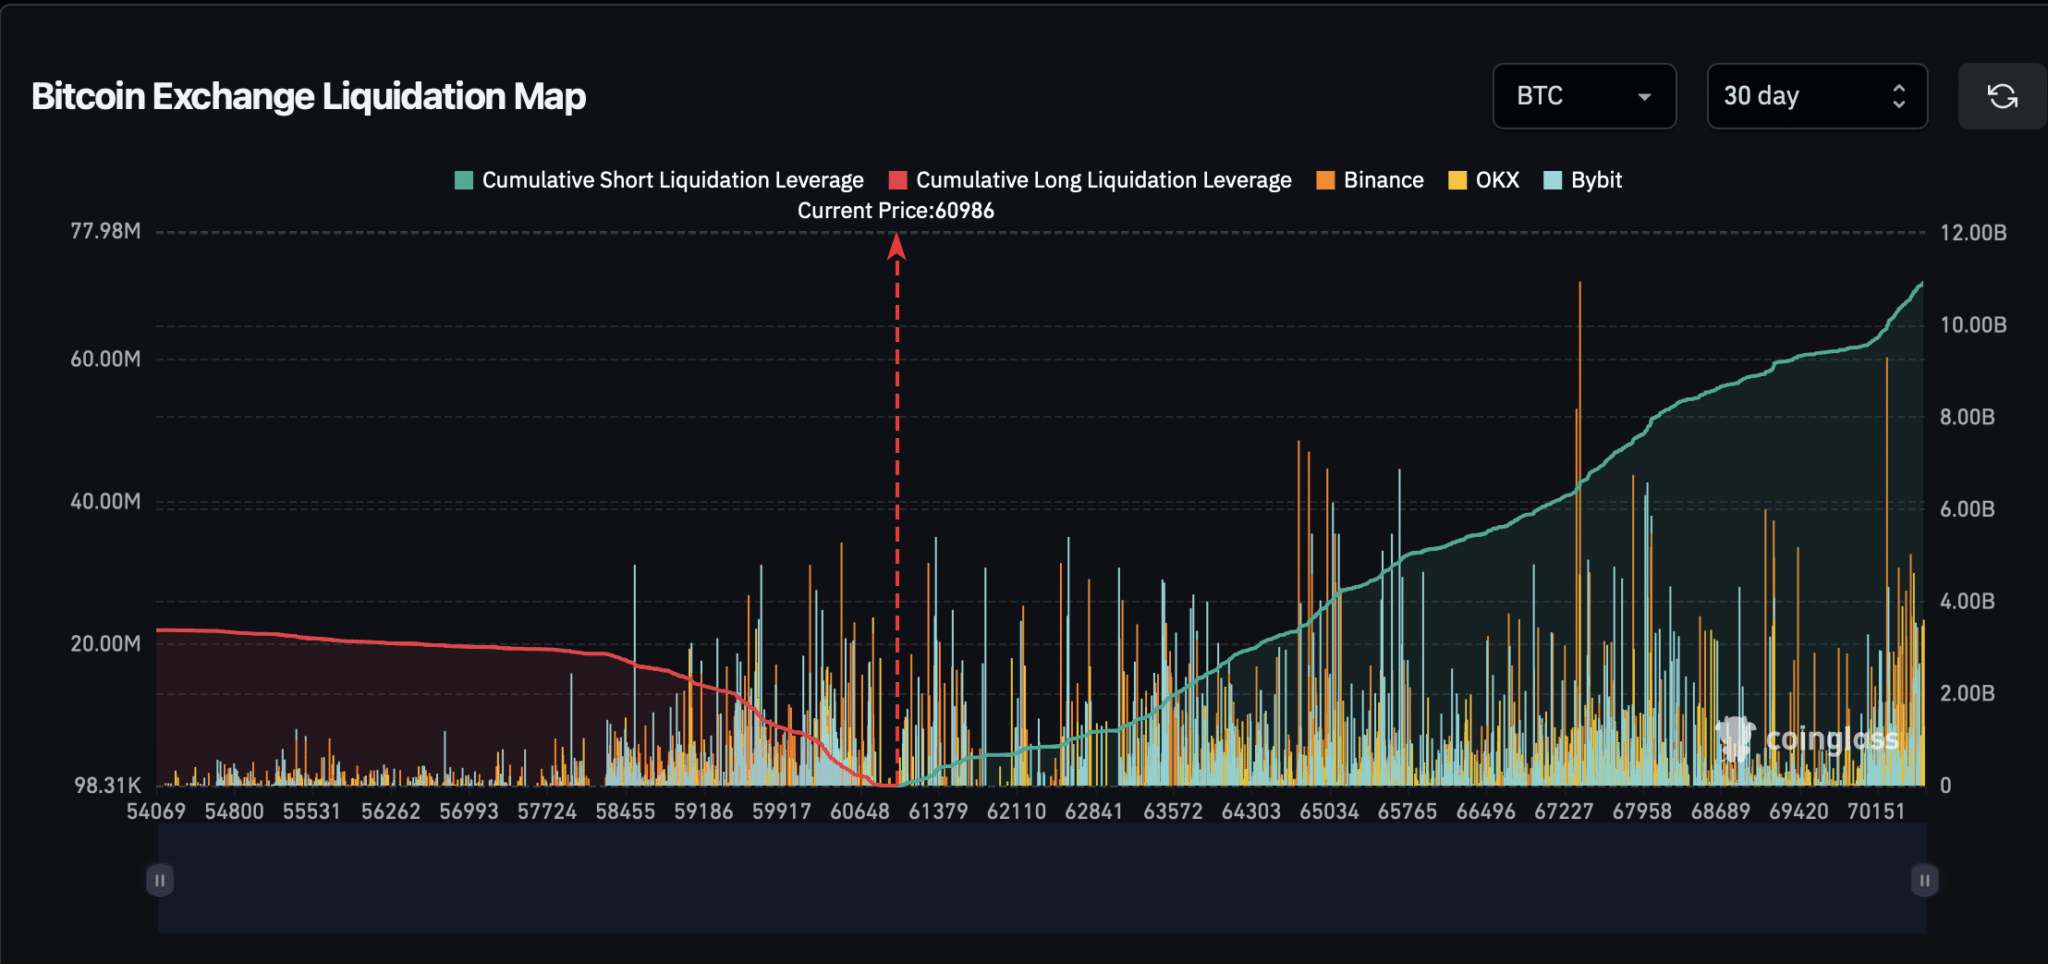
While these indicators suggest a potential downturn, it’s essential to consider broader market trading. Analysis of liquidation leverage on Coinglass reveals that the majority of liquidations in the past 30 days were long positions, indicating that many traders might still be betting on an increase in Bitcoin’s value.
Moreover, recent reports from ETHNews indicate a positive trend in miner activity, with an increase in miners’ reserves, which could support Bitcoin’s price in the near future.
Overall, while on-chain indicators like the LTH inflation rate and Dormancy Flow suggest a market peak, the actual impact on Bitcoin’s price will depend on a variety of factors including trader behavior and external market influences.
Bitcoin (BTC) Price Analysis
Bitcoin (BTC) is currently trading at 60,280 USDT, having fallen 2.97% in the past 24 hours. Over the past week, BTC has decreased by 2.47%, and in the past month, it has seen a decline of 11.05%. However, over the last year, BTC has increased by 93.48%. The highest price BTC reached was 73,777 USDT on March 14, 2024, while its lowest was 2,817 USDT on September 15, 2017.
Technical Analysis
- Short-Term Performance: The technical analysis for BTC today shows a sell signal.
- Weekly Rating: Neutral signal.
- Monthly Rating: Buy signal.
Predictions
- Short-Term Prediction: BTC might continue experiencing volatility. Traders should prepare and examine all available information before making decisions.
- Long-Term Prediction: Given its significant yearly increase, BTC could still be seen as a strong asset in the long term.


