


XRP continues to respect a multi-year ascending channel that has been intact for more than a decade.
The analysis from Dark Defender suggests that if this structure remains valid, the upper boundary of the channel points toward a potential move near $18.
The 13-Year Ascending Channel
On the monthly timeframe, XRP is trading inside a broad upward channel that began forming around 2013–2014. The lower trendline has consistently acted as macro support, while the upper boundary has defined major cycle tops.
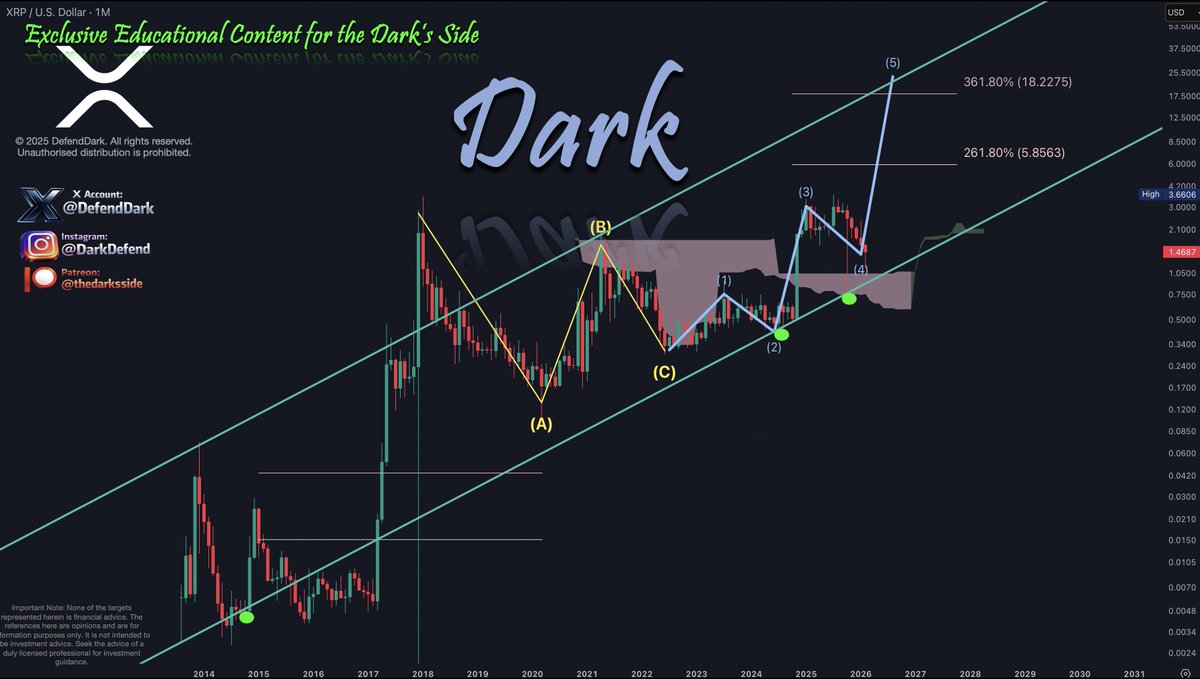
Each major correction has respected the lower boundary of this channel, followed by impulsive rallies toward the upper range. According to the chart, the most recent reaction occurred near the lower half of the structure, reinforcing the idea that the long-term uptrend remains technically intact.
If price rotates toward the upper boundary again, the projected extension aligns with the $18 region, which also coincides with Fibonacci expansion levels shown near 361.8%.
Elliott Wave Structure on the Chart
The formation on the right side of the chart outlines a five-wave impulse structure labeled (1) through (5):
- Wave (1) marks the initial breakout from accumulation.
- Wave (2) represents a corrective pullback.
- Wave (3) shows a strong expansion phase, typically the most aggressive leg.
- Wave (4) reflects consolidation and structural compression.
- Wave (5) is projected as the final impulsive leg toward higher Fibonacci targets.
The chart also displays a prior ABC corrective structure labeled (A), (B), and (C), which appears to have completed before the current impulsive wave began. This sequence suggests that XRP may have transitioned from a corrective macro phase into a new expansion cycle.
Consolidation Zone and Compression
A highlighted horizontal supply zone sits above current price, showing where prior rejection occurred. XRP recently broke down from that area but is attempting to stabilize near the lower support region of the ascending channel.
The smaller descending channel labeled “compression” indicates tightening volatility before a breakout. In technical terms, compression phases often precede expansion moves, though direction depends on confirmation.
Key Levels to Watch
- Current price area: around $1.46
- Major horizontal resistance: near $2.10–$2.20
- Channel midline: dynamic resistance during recovery
- Upper channel target: aligns structurally near $18
If XRP reclaims higher structure and breaks above the consolidation supply zone, momentum could build toward the channel’s upper boundary. However, failure to hold the ascending channel support would invalidate the long-term bullish thesis.
Structural Outlook
The chart presents a clear macro framework rather than a short-term trade setup. The ascending channel has defined XRP’s market structure for over a decade. As long as that structure holds, higher targets remain technically possible.
Whether the projected $18 level is reached depends on confirmation through sustained higher highs, volume expansion, and broader market participation. For now, the long-term channel remains the defining feature of XRP’s macro chart.


