


XRP has slipped back toward the $1.88–$1.89 area after failing to sustain upside momentum, with the latest TradingView chart showing a clear loss of strength following multiple intraday rejections.
The move comes as broader sentiment remains cautious, volatility stays elevated, and buyers struggle to reclaim key moving averages overhead.
Price Action: Where the Move Broke Down
On the 1-hour chart, XRP attempted several pushes higher earlier in the session, briefly testing the $1.94–$1.95 zone. Each advance was met with selling pressure, forming a sequence of lower highs. The decisive moment came when price rolled over and broke below short-term support near $1.90. That level had previously acted as a consolidation floor, but once lost, downside follow-through accelerated toward the current $1.88 region.
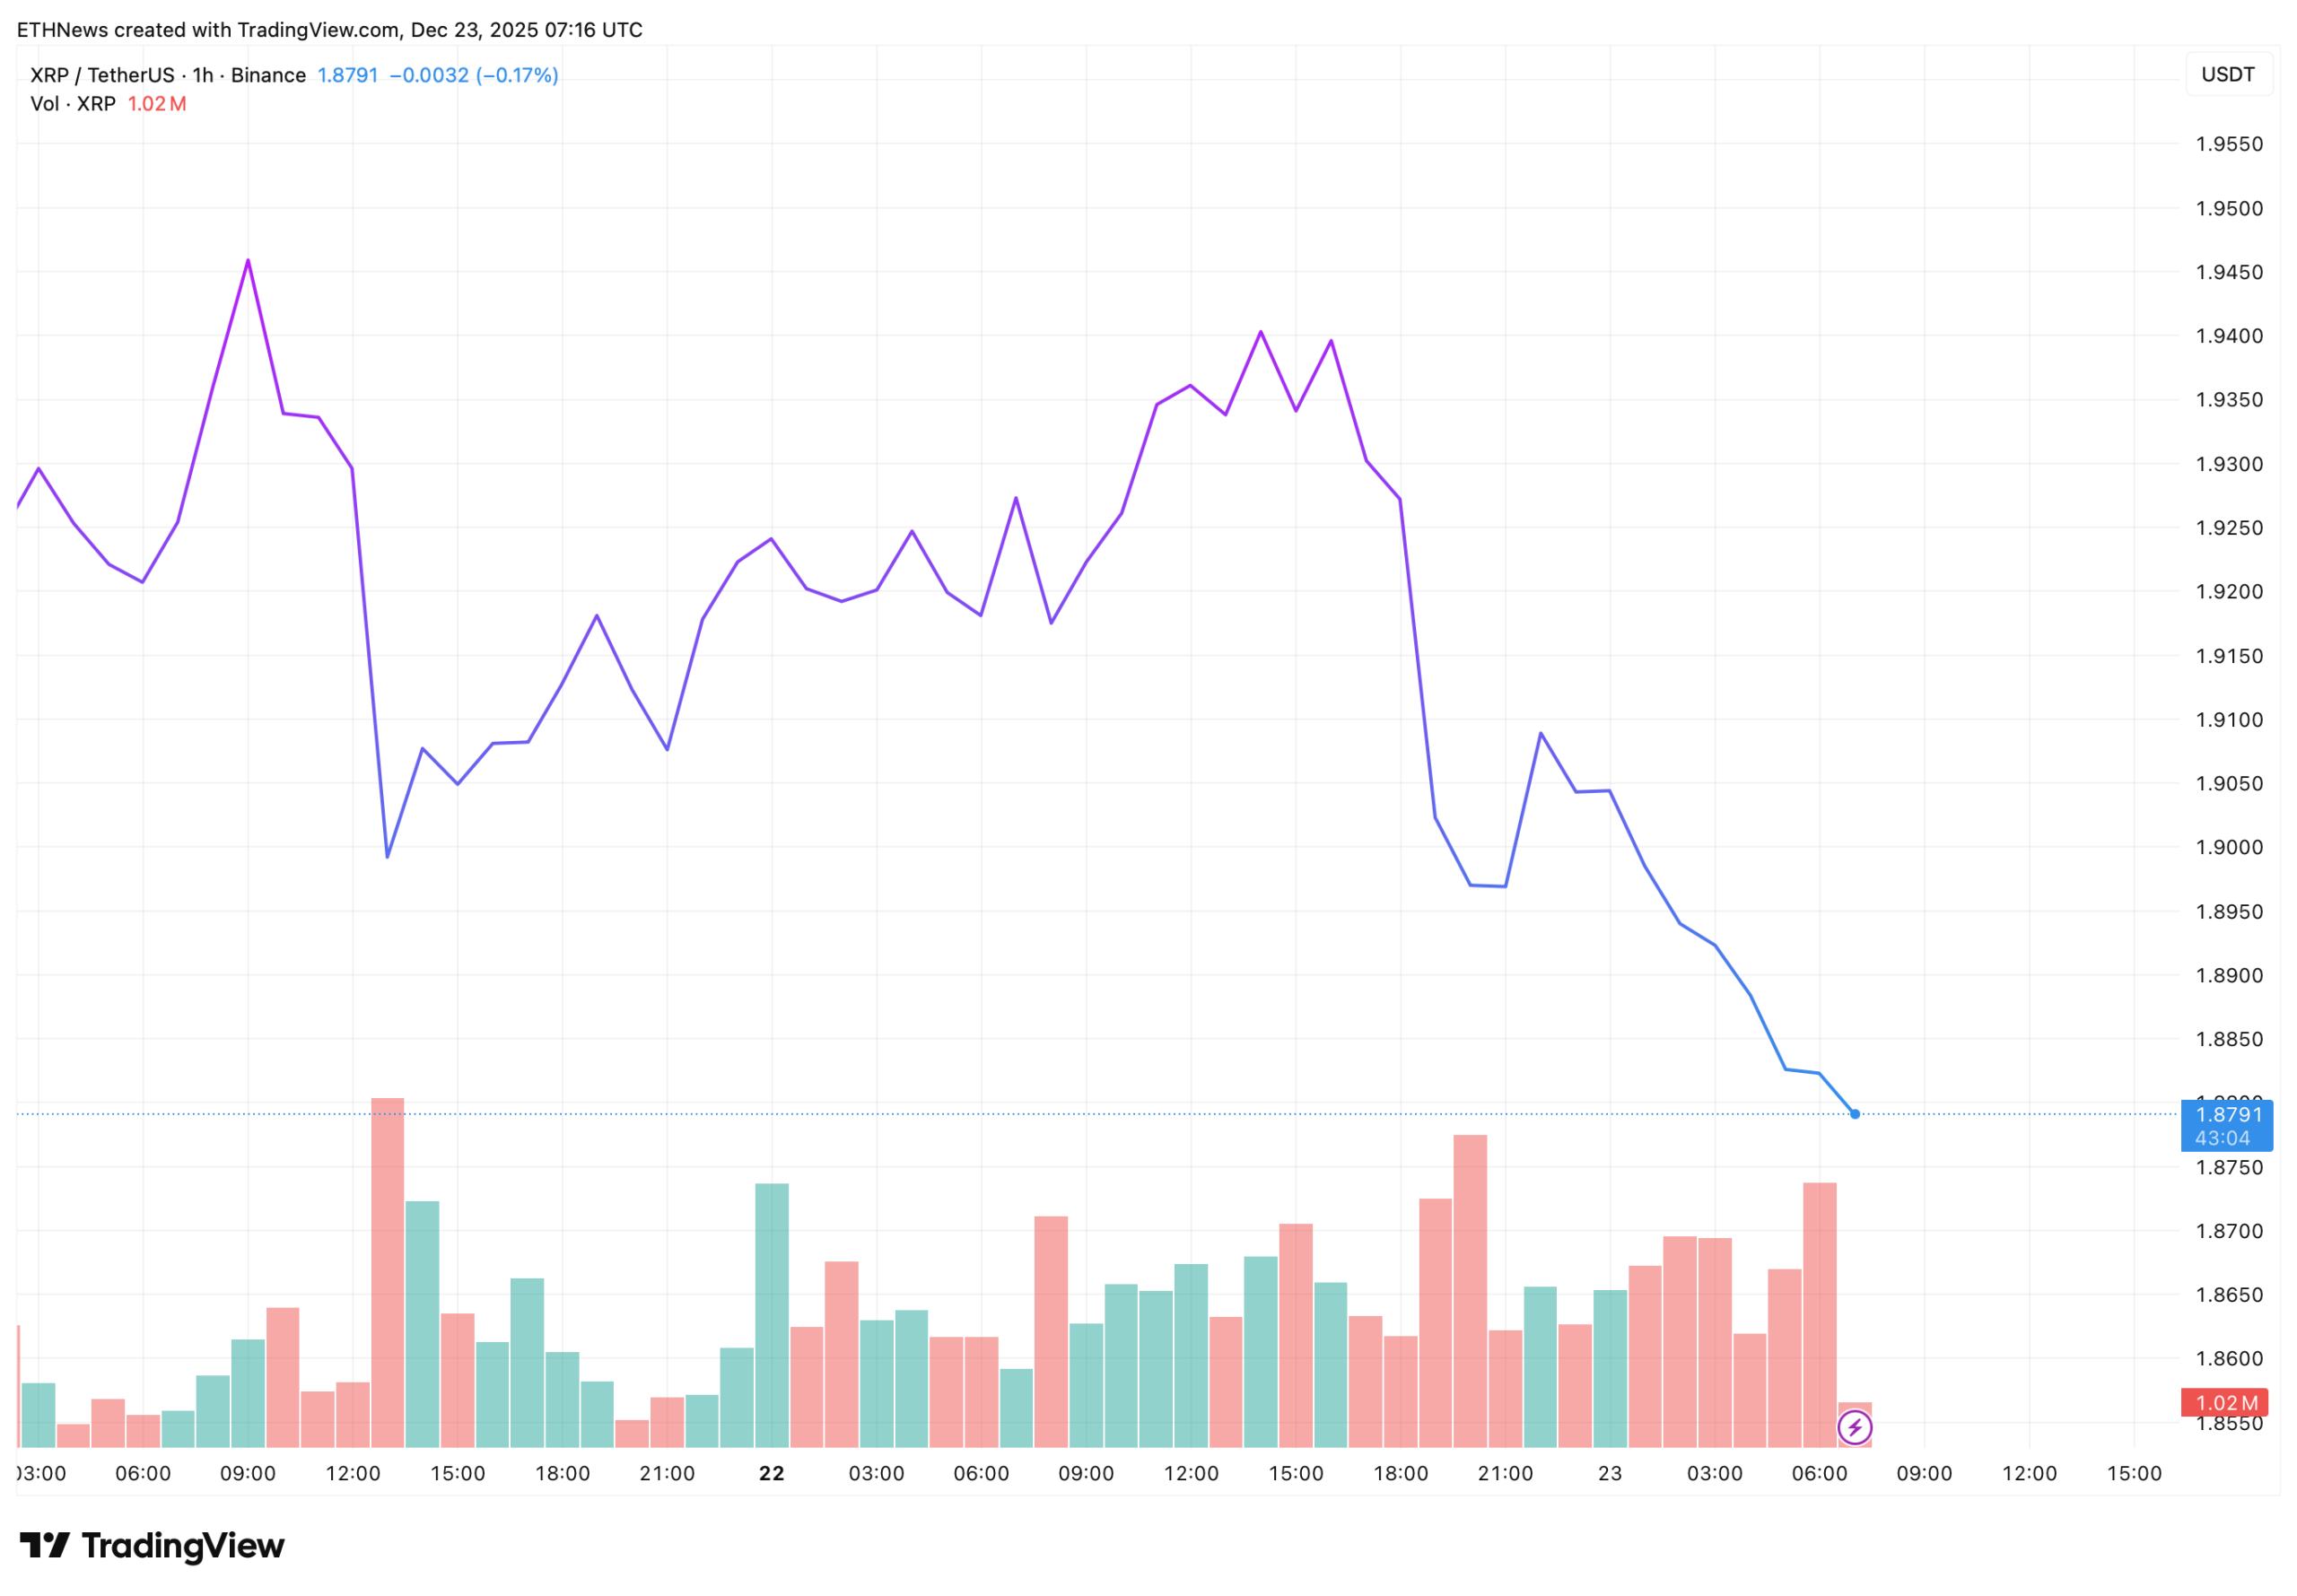
Volume behavior supports this interpretation. Red volume bars expanded during the selloff, particularly during the sharp drop from the $1.93 area, suggesting active distribution rather than a low-liquidity drift. By contrast, rebound attempts showed weaker participation, signaling limited conviction from buyers.
Indicators and Structure: A Market in Pause Mode
The indicator snapshot reinforces what the chart structure implies. XRP trades well below its 50-day SMA near $2.15 and even further beneath the 200-day SMA around $2.54, keeping the broader trend tilted to the downside. The 14-day RSI sits near 41, a neutral reading that reflects fading momentum rather than oversold conditions. This means price still has room to move lower without triggering a technical reset.
Volatility remains high, above 5%, which explains the sharp intraday swings seen on the chart. However, volatility alone has not translated into upside continuation. Instead, it has amplified both failed breakouts and quick sell-offs, a classic sign of an indecisive but fragile market structure.
Key Levels to Watch
The immediate support zone sits around $1.88–$1.87, where price is currently hovering. A clean hourly close below this area would expose the lower $1.85 region, visible on the chart as the next area where buyers previously stepped in. On the upside, $1.90 now flips into first resistance. Above that, the $1.94–$1.95 zone remains the critical ceiling XRP must reclaim to invalidate the current bearish structure.
Without a strong reclaim of these levels, rallies are likely to be sold into rather than extended.
What Comes Next
From a structural perspective, XRP appears stuck in a short-term corrective phase rather than an outright breakdown. The failure near $1.95 shows buyers are present but hesitant, while the loss of $1.90 confirms sellers still control the tape. If price stabilizes above $1.87 and volume contracts, a sideways base could form. However, continued weakness below support would shift focus toward deeper retracement zones.
For now, the chart argues for caution. XRP needs clear confirmation, through higher lows, stronger volume on rebounds, and a reclaim of $1.90, to suggest that downside pressure is easing. Until then, the path of least resistance remains slightly lower, with volatility keeping both bulls and bears on edge.


