


XRP’s performance against Bitcoin has tightened into one of the most compressed ranges seen in months, and new analysis from chartist EGRAG CRYPTO is shedding light on what this structure could mean. While XRP/BTC has spent most of the last six weeks drifting lower, the pair is now showing signs of stabilization, and that shift is what prompted EGRAG to publish a multi-scenario “simulation exercise” mapping out several possible long-term outcomes.
This simulation is not a price prediction, but an attempt to examine how XRP could behave under different ratio structures, each tied to specific historical formations.
A Market Stuck in Narrow Range, but Not Without Signals
On the XRP/BTC chart, the pair is hovering around 0.00002335 BTC after recovering from an early-November low. Volatility remains muted, with MACD flattening near the baseline and RSI oscillating in the mid-40s, a sign of neutral momentum rather than capitulation or breakout energy.
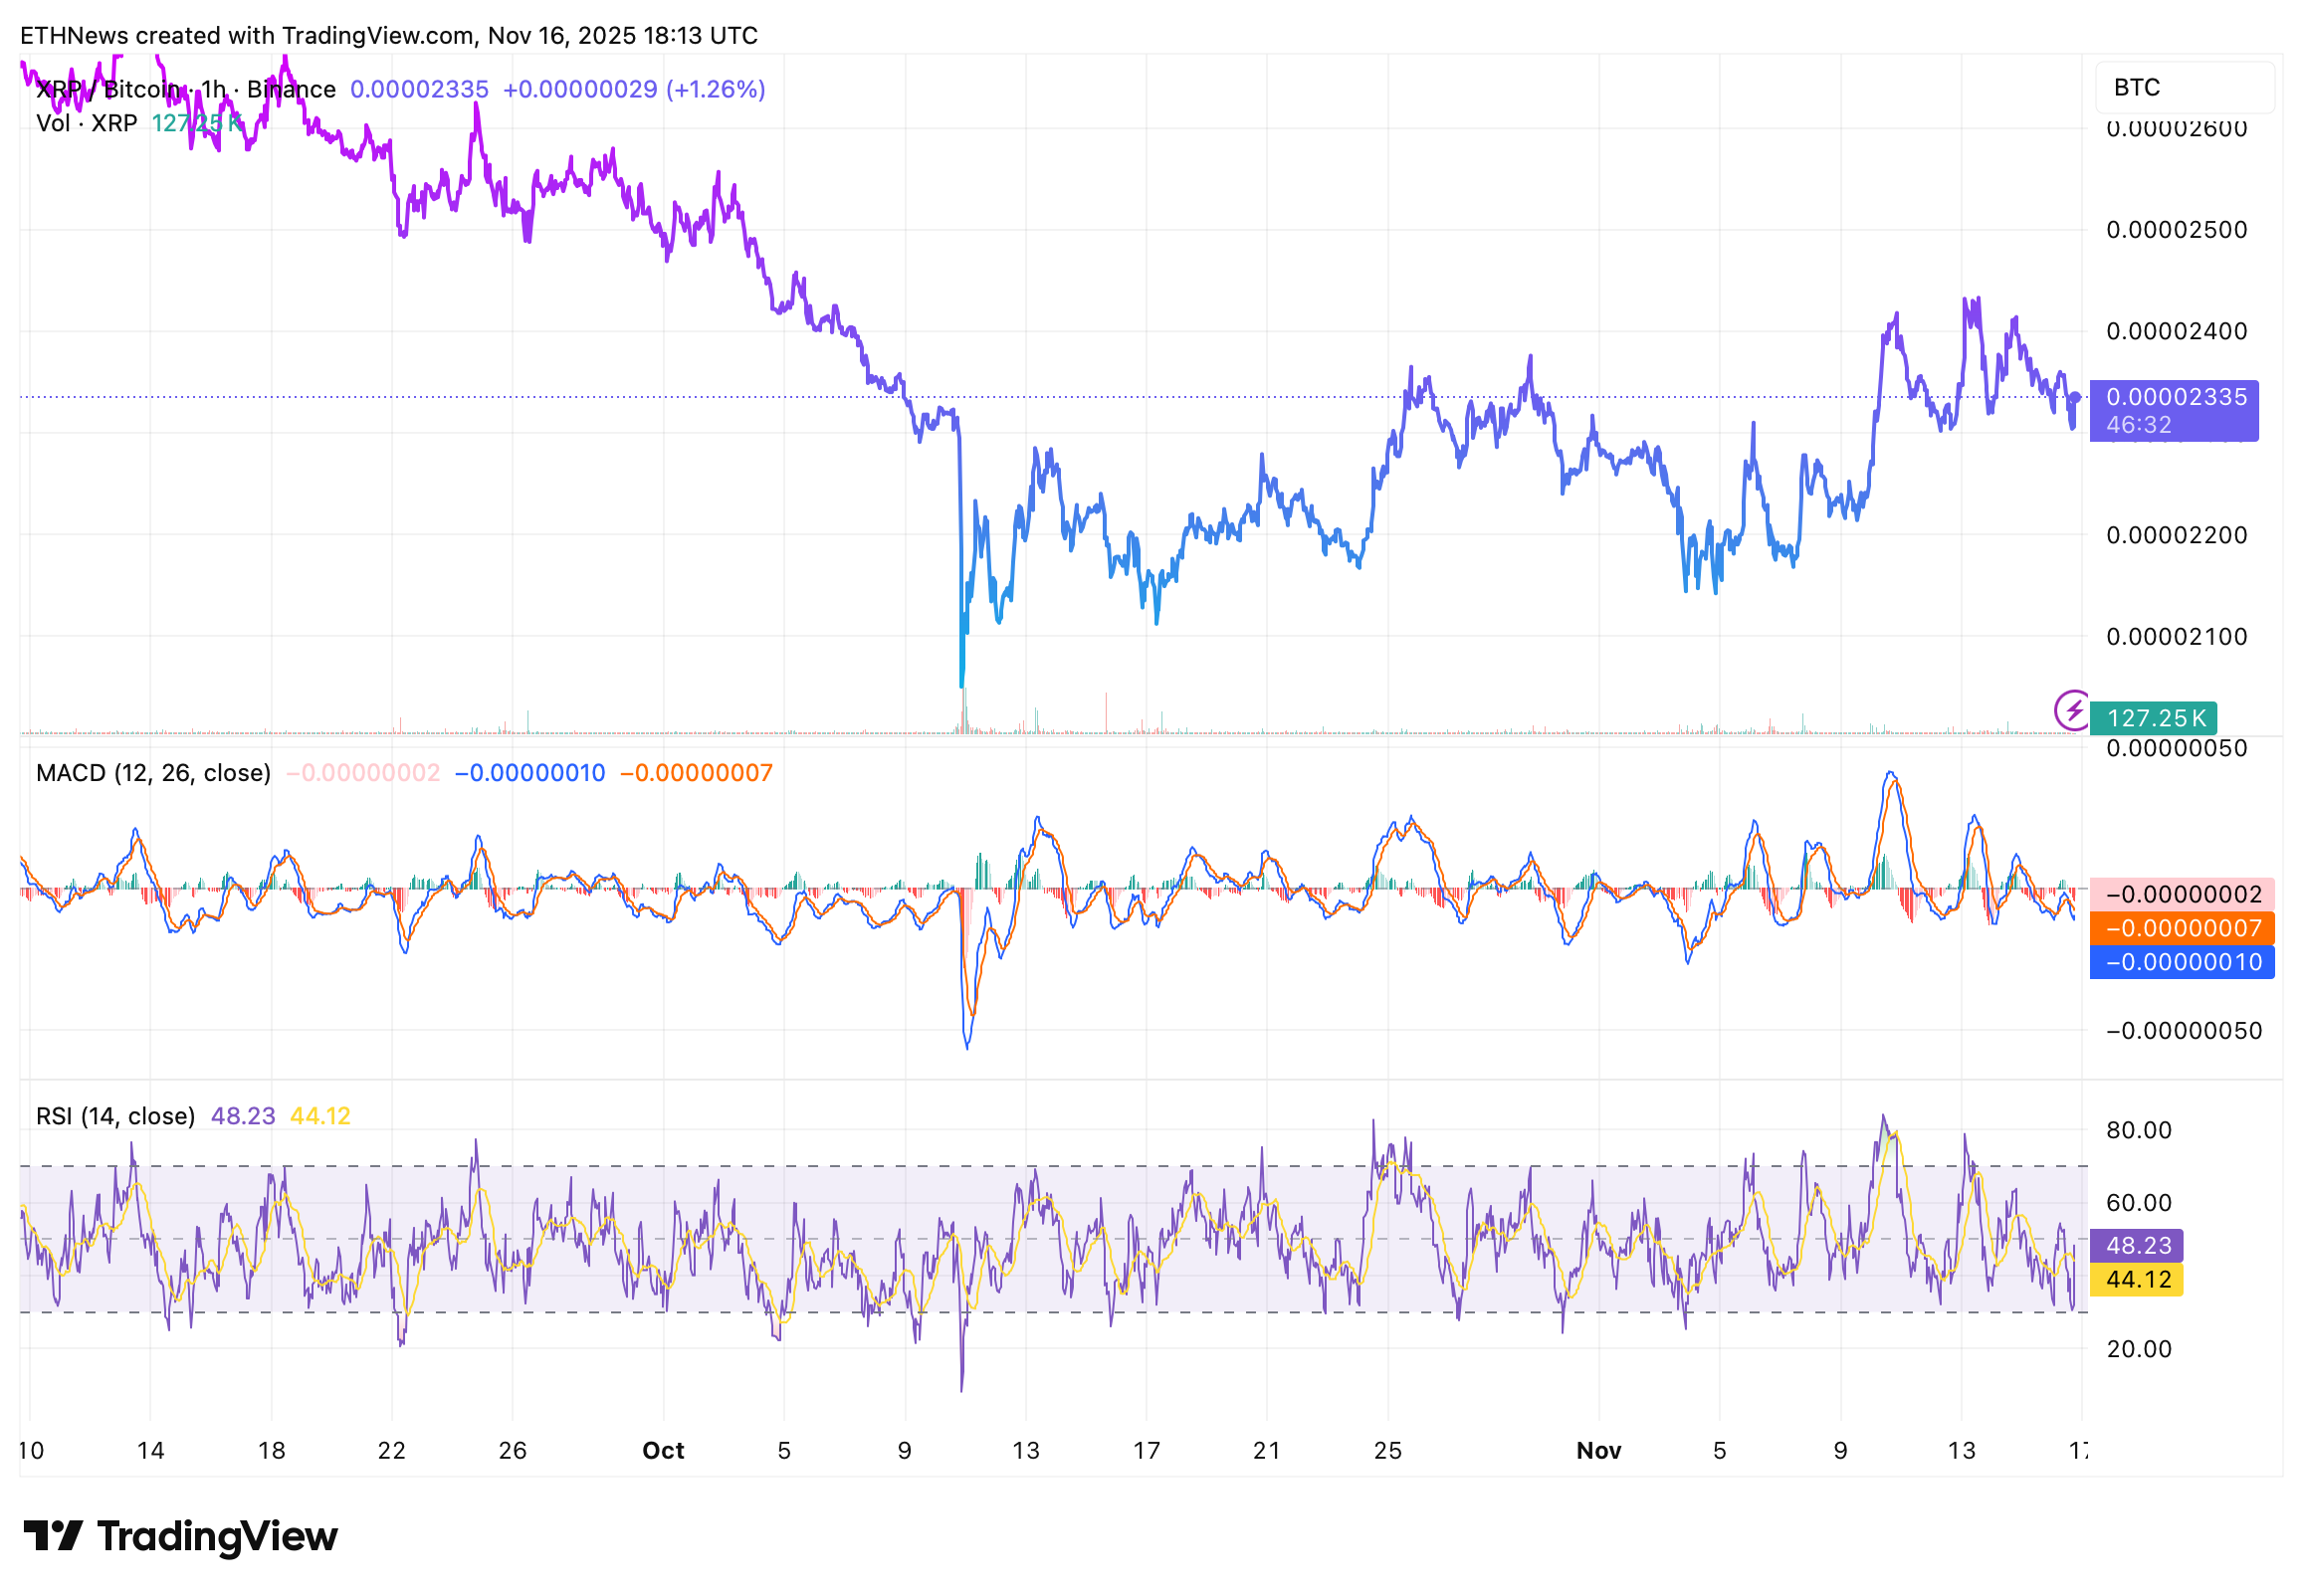
Despite the lack of explosive movement, this type of compression has historically preceded major expansions in the XRP/BTC ratio. It is this historical behavior that EGRAG’s framework attempts to decode.
Inside the “Mean $11 XRP” Simulation
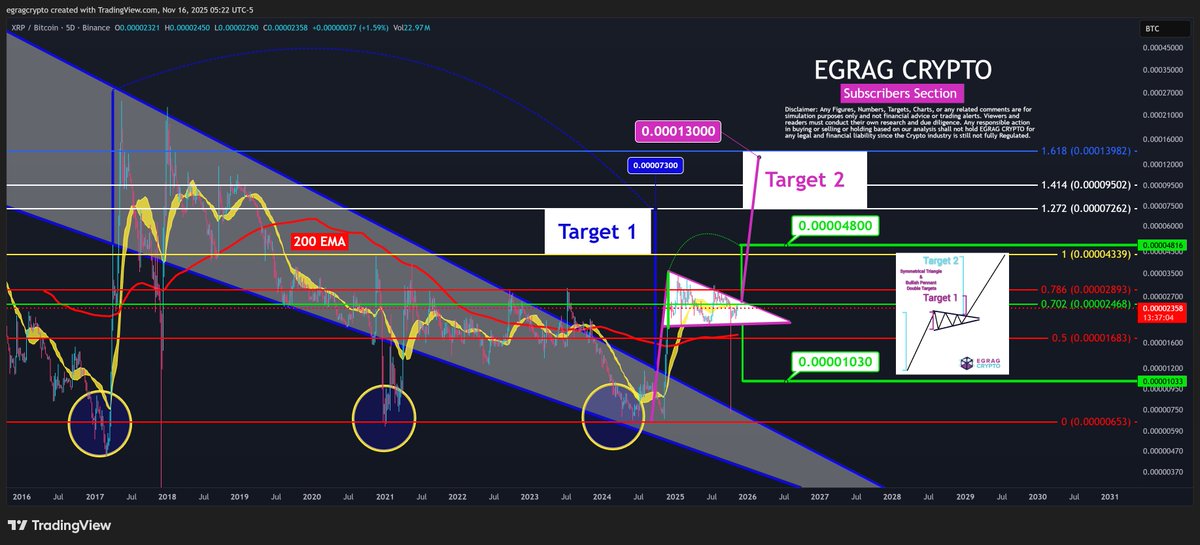
EGRAG’s exercise evaluates XRP/BTC through multiple ratio-based formations, each reflecting how the asset behaved in prior cycles dating back to 2016. The analyst highlights:
- Long-term descending channel breaks
- Fibonacci-based extension zones
- Triangle formations with explosive endpoints
- Mean-reversion calculations that historically align with major XRP cycle tops
From these structures, EGRAG identifies a mean outcome equivalent to $11 XRP, assuming XRP/BTC returns to ratios seen in previous expansion phases. But he repeats that this is not a prediction, it’s a scenario map designed to show the full range of potential outcomes if XRP were to repeat historical behavior.
What the Chart Structure Suggests Right Now
The XRP/BTC pair is currently sitting near the bottom of a multi-year trend channel, the same area where prior major cycle reversals began. Historically, XRP/BTC bottoms formed when:
- BTC dominance peaked,
- Market volatility compressed, and
- XRP’s RSI fell into the 30–40 zone before recovering.
With BTC dominance elevated and XRP’s volatility thinning, the setup resembles early-stage accumulation phases from 2017, 2020 and 2023.
Why Traders Are Paying Attention
Even though XRP’s price in USD remains range-bound, ratio analysis can reveal early turning points long before the broader market notices. For many experienced traders, XRP/BTC strength has historically led major XRP rallies, often weeks or months before USD charts reflected the momentum.
EGRAG’s simulation serves as an analytical roadmap rather than a prediction, but it arrives at a moment when XRP/BTC is pressing into historically important territory. If the compression resolves upward, it would signal the first sustained bullish reversal on the pair in months.
If it breaks lower, the multi-month drift could continue.
For now, all eyes remain on whether XRP/BTC can hold the current support cluster, because the last time it did, the move that followed became one of XRP’s strongest percentage expansions of that cycle.


