


XRP’s price structure is nearing a critical technical threshold that could determine whether the token breaks out toward new highs or loses its bullish footing, according to pseudonymous chart analyst TradingShot.
2017 Pattern Reappears on Weekly Chart
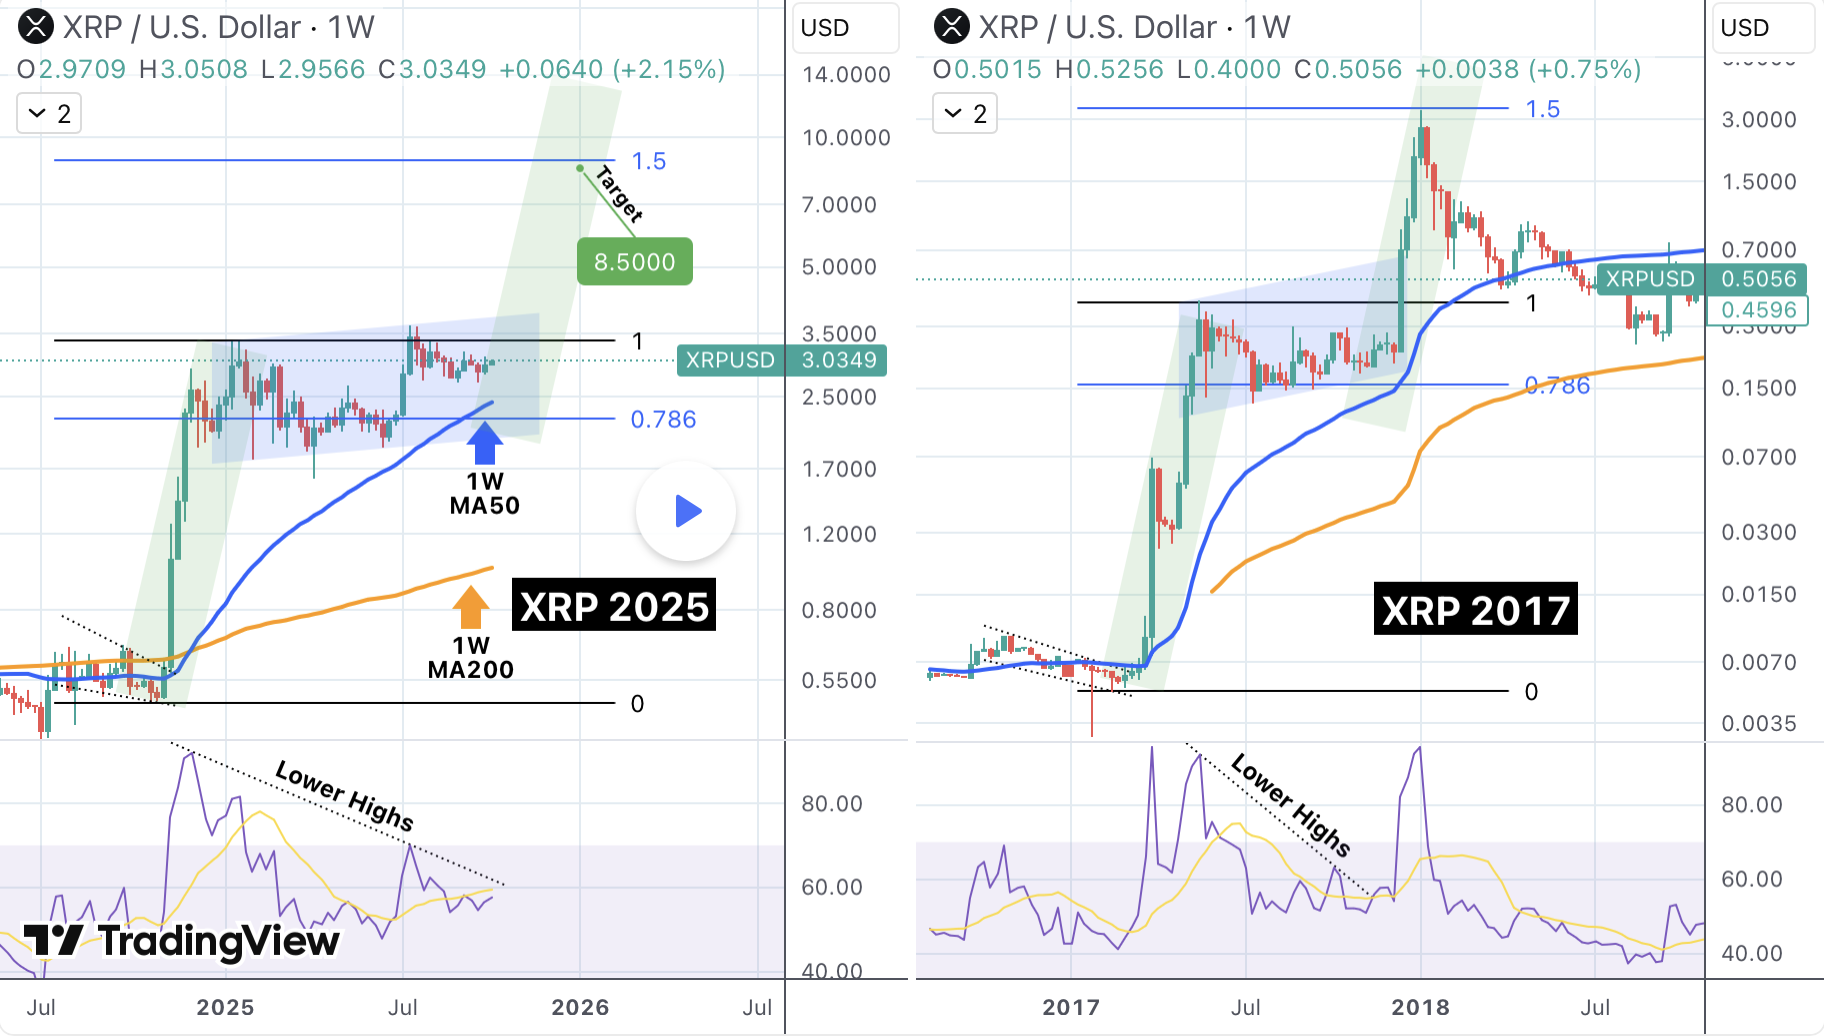
In his latest TradingView post, the analyst highlights striking similarities between XRP’s current weekly pattern and its late-2017 setup, the same formation that preceded a meteoric rise from $0.50 to $3.65, marking its all-time high.
TradingShot argues that XRP’s sideways movement since its July 2025 peak mirrors the consolidation phase before that historic breakout. The token is now approaching its 1W MA50 (weekly 50-day moving average), which served as the pivotal support level during the 2017 surge.
“If the trendline holds,” he wrote, “this could trigger the same explosive move we witnessed in December 2017.”
Targeting $8.50 on Fibonacci Extension
According to TradingShot’s model, if XRP maintains its bullish structure, the next target sits near $8.50, aligning with the 1.5 Fibonacci extension level. The analyst noted that even the weekly RSI sequences between both cycles appear identical, strengthening the probability of a similar breakout pattern.
For traders, the next few weeks could represent a decisive moment: a sustained hold above the MA50 trendline may validate the fractal setup, while a breakdown could invalidate the bullish scenario entirely.
As XRP tests this “now-or-never” zone, investors are watching closely to see whether history will indeed repeat itself, or if the 2025 cycle will diverge from one of the most explosive chapters in XRP’s past.


