


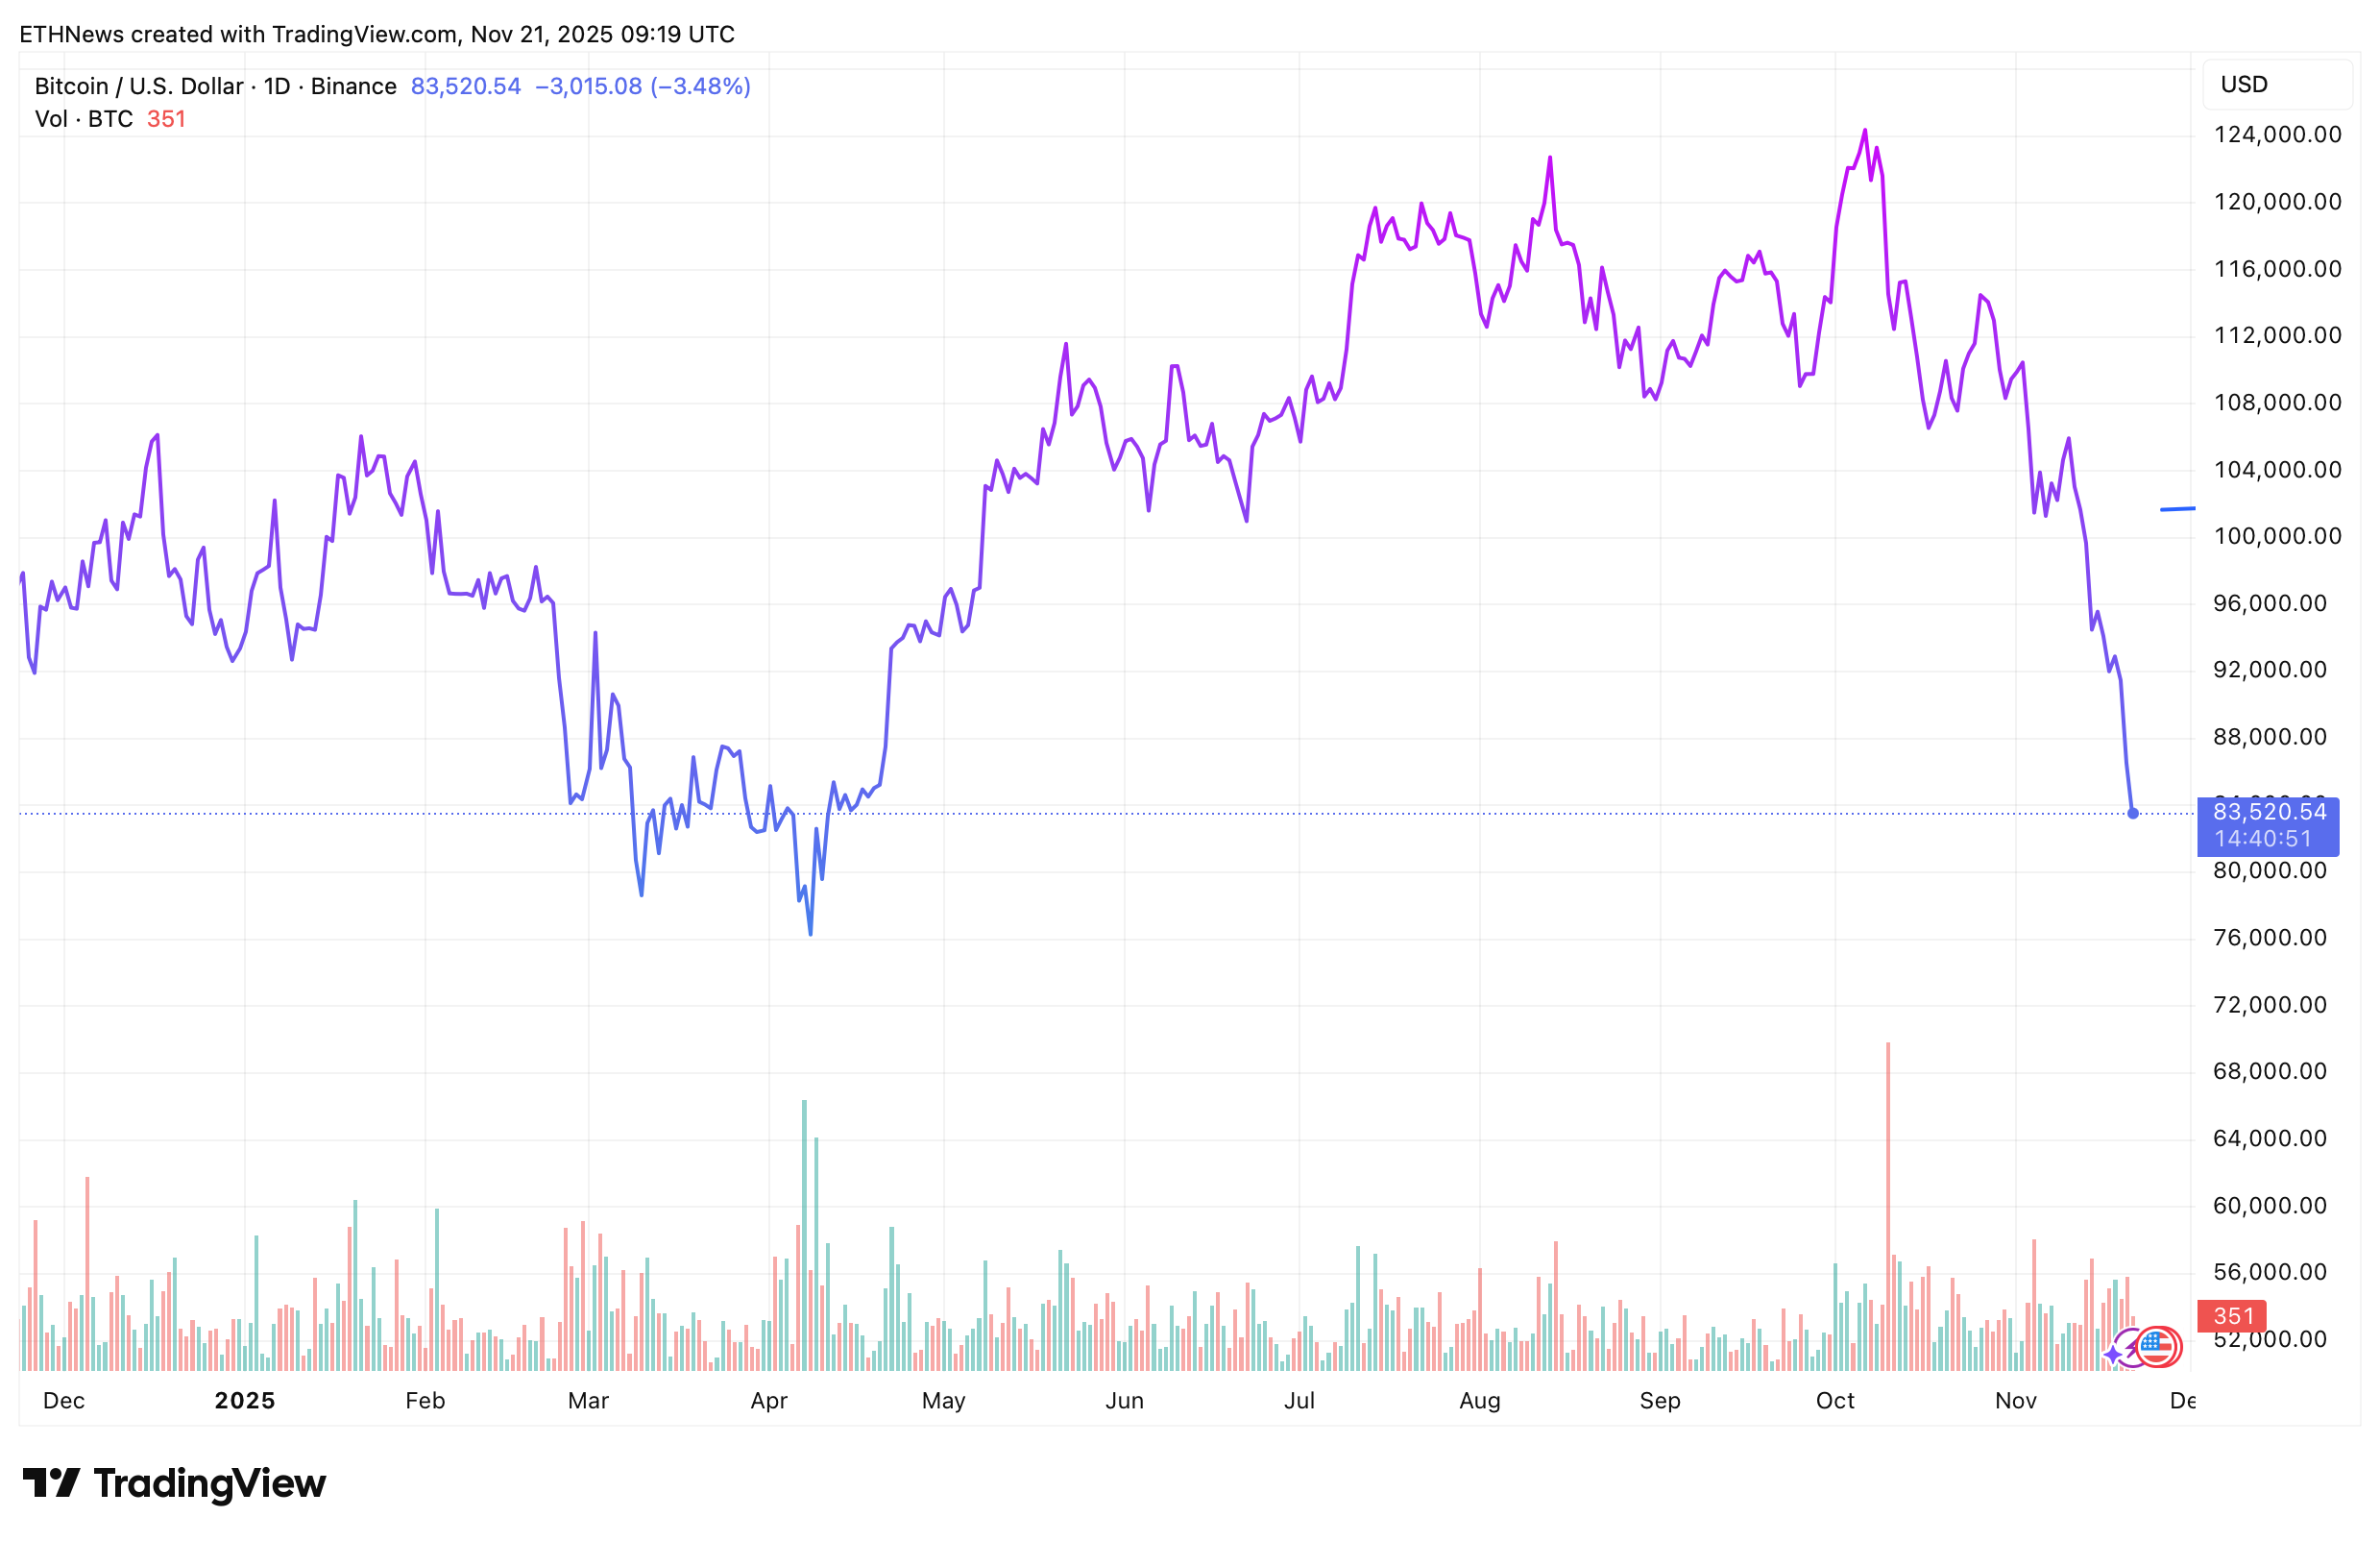
Bitcoin’s November decline has accelerated into one of the steepest and most persistent drawdowns of the year, with the market now trading near $83,000 and momentum firmly pointing lower.
The move extends a 45-day slide that began after October’s all-time high and has since wiped out more than 30% of Bitcoin’s value. What makes this downturn different is the growing consensus among analysts that the market is approaching its max-pain zone, levels that historically mark capitulation and the formation of a cycle bottom.
The Max-Pain Targets: $84K and $73K
According to André Dragosch, head of research at Bitwise Europe, two cost-basis levels now define the likely endpoints of the selloff.
FWIW —
Think max max pain is reached the moment we tag either the IBIT cost basis at 84k or MSTR cost basis at 73k.
Very likely we’ll see a final bottom somewhere in between.
But these will be fire sale prices and akin to a full cycle reset imo.
— André Dragosch, PhD⚡ (@Andre_Dragosch) November 19, 2025
The first sits near $84,000, the average entry price for BlackRock’s IBIT, the largest spot Bitcoin ETF in the world. The second lies deeper at roughly $73,000, the estimated cost basis for Strategy Inc. (MSTR), the biggest corporate holder of Bitcoin.
Dragosch argues that a retest of either zone could trigger a full cycle “clear-out”, flushing the remaining leverage from the market and setting the stage for a final bottom somewhere in between. He described these areas as “fire-sale prices” that would represent a wholesale reset of speculative positions built up throughout 2025.
ETF Outflows and Structural Selling Continue
Pressure remains intense heading into late November. The spot ETF ecosystem saw one of its largest redemption days on record this week, accelerating Bitcoin’s fall and intensifying forced selling across derivatives markets. With BTC now well below key support levels and volatility still rising, the market has entered a phase where structural flows, rather than macro headlines, are dictating direction.
What Comes Next
If Bitcoin continues to mirror prior cycle mechanics, the final flush typically arrives shortly after max-pain levels are tagged. Dragosch’s model suggests the capitulation zone is now just below current prices, with $84K–$73K acting as the range where long-term investors may begin absorbing supply.
Whether the bottom forms at the upper boundary or the deeper MSTR cost basis remains uncertain, but analysts agree on one point: the next major move will likely define the rest of the cycle.


