


SUI is showing early signs of stabilization after a prolonged period of downside pressure. Following a sharp selloff that unfolded into early February, price action has shifted into a more controlled consolidation phase, suggesting the market is attempting to establish a short-term base rather than continuing a straight-line decline.
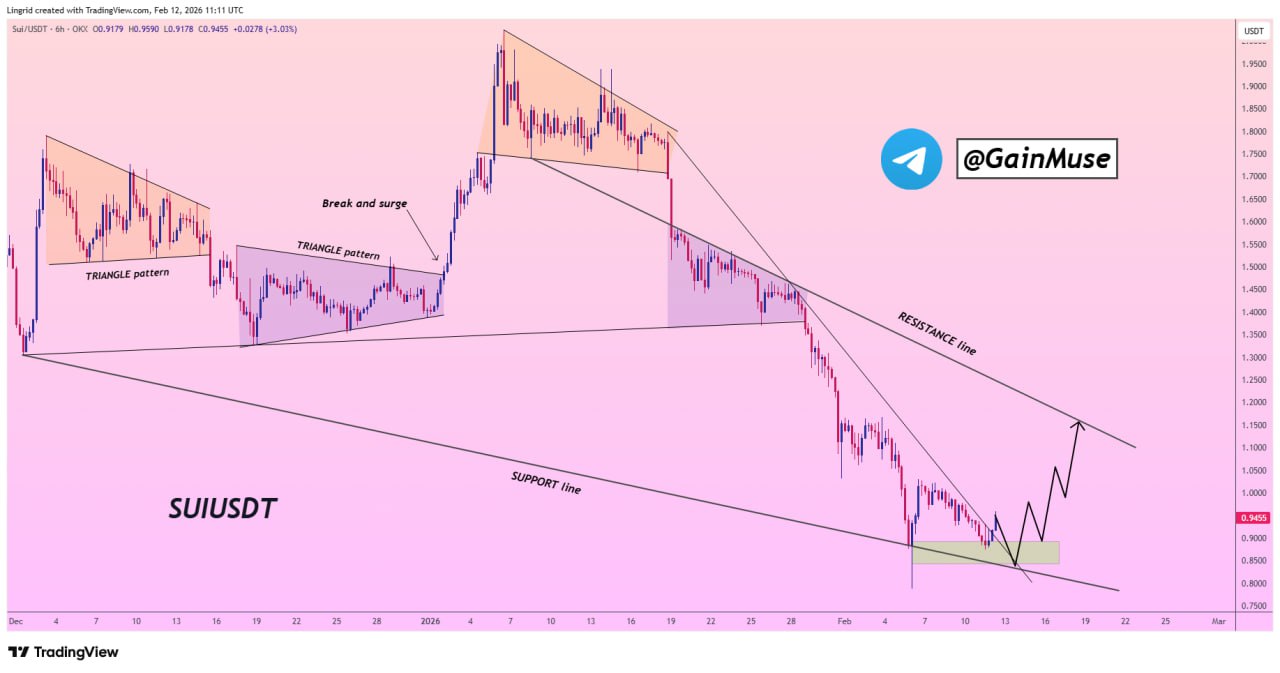
Descending triangle resolution sets current structure
This behavior aligns with the structure outlined by crypto trader GainMuse, where SUI previously compressed inside a descending triangle. His chart highlights sustained pressure from descending resistance, followed by a decisive volatility expansion that resolved the compression phase and pushed price into a lower structural range.
Current price and key levels in focus
At the time of writing, SUIUSDT is trading around $0.916, as shown on the TradingView chart. After printing local lows near the lower boundary of the structure, price rebounded sharply before transitioning into sideways movement, indicating a pause in downside momentum.
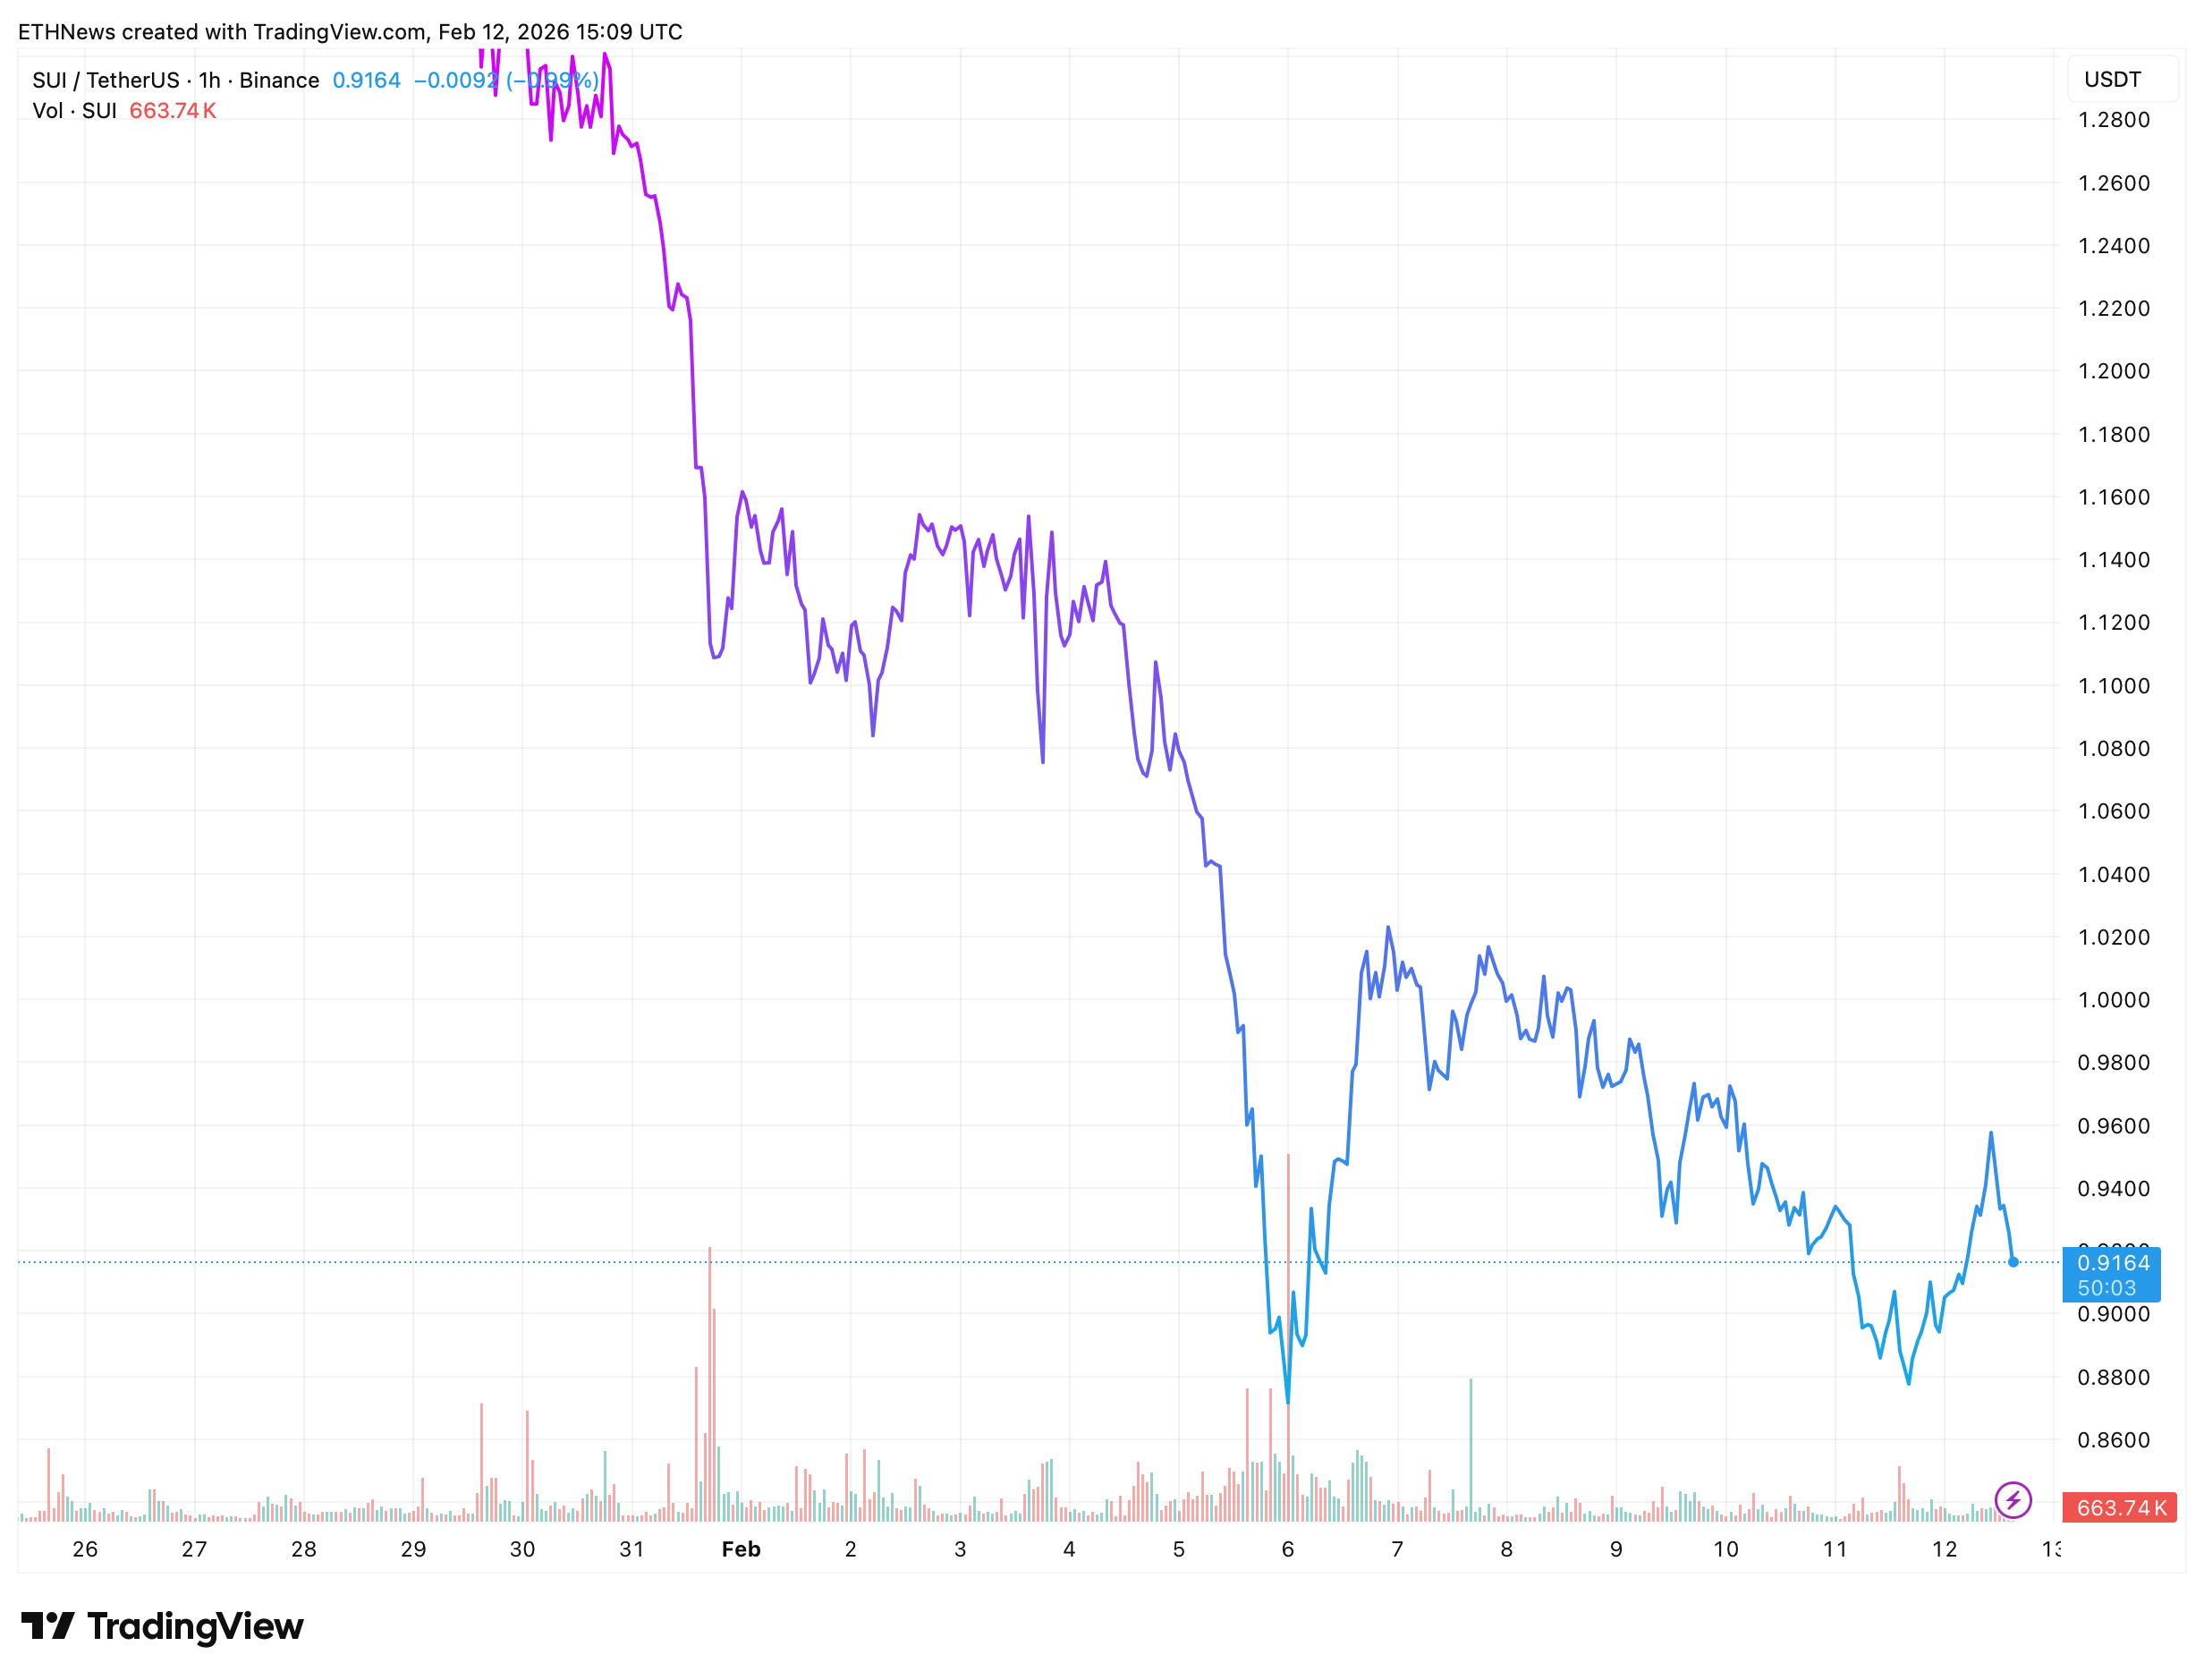
The $0.88–$0.90 zone stands out as a key support area, where buyers stepped in decisively following the selloff. Above current price, the $0.98–$1.00 region represents near-term resistance, visible through multiple failed rebound attempts. The descending resistance line remains intact overhead, continuing to define the broader trend structure.
Volume behavior confirms consolidation phase
Volume behavior supports this interpretation. Elevated volume accompanied both the selloff and the initial rebound, while subsequent consolidation has taken place on reduced activity, consistent with a market shifting from impulse-driven movement into consolidation.
Structural outlook from here
From a structural standpoint, SUI is no longer compressing. Price is now reacting within a stabilization zone, where the next directional move will depend on whether support continues to hold or sellers regain control near resistance.


