


SUI remains under sustained technical pressure as price action continues to reflect weakness following a sharp structural breakdown.
The broader market structure shown on the chart favors continuation rather than recovery, with sellers maintaining control across key levels.
Breakdown Confirms Dominant Downtrend
Crypto analyst Gainmuse’s chart shows that SUI broke down from a prior range, triggering a sharp sell-off and invalidating earlier consolidation attempts. After the breakdown, price failed to recover lost structure and instead moved lower, reinforcing the prevailing bearish trend.
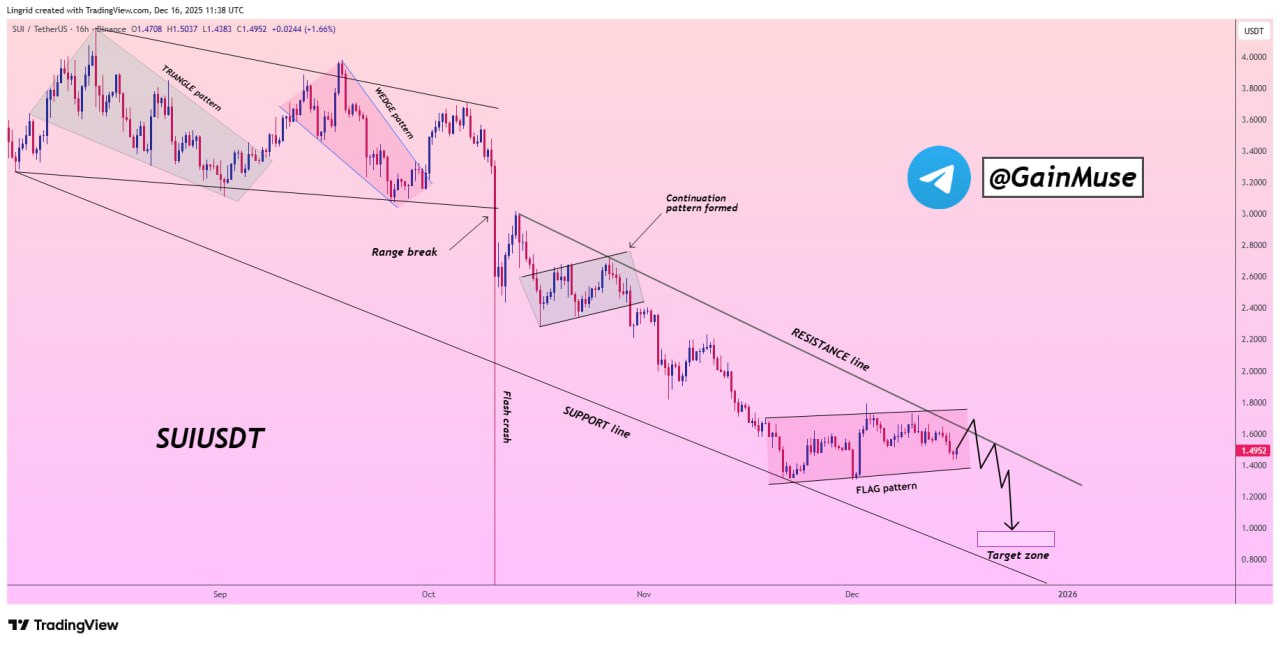
Price action now sits firmly below a dominant descending resistance line. Each rebound attempt has been capped beneath this level, confirming that overhead supply remains active and limiting upside momentum.
Bearish Flag Signals Consolidation, Not Reversal
Following the breakdown and flash crash, SUI entered a period of sideways consolidation along the lower boundary of the trend. The structure forming resembles a bearish flag, a pattern typically associated with continuation rather than trend exhaustion.
This consolidation reflects a pause in selling pressure rather than renewed demand. As long as price continues to respect the falling resistance and fails to reclaim it, the technical bias remains tilted toward further downside.
Support Break Keeps Downside Risk Elevated
On the lower timeframe, SUI recently experienced another sharp drop, followed by a modest bounce. However, the recovery remains shallow and lacks structural strength. Price is still trading well below prior support zones, which now act as resistance.
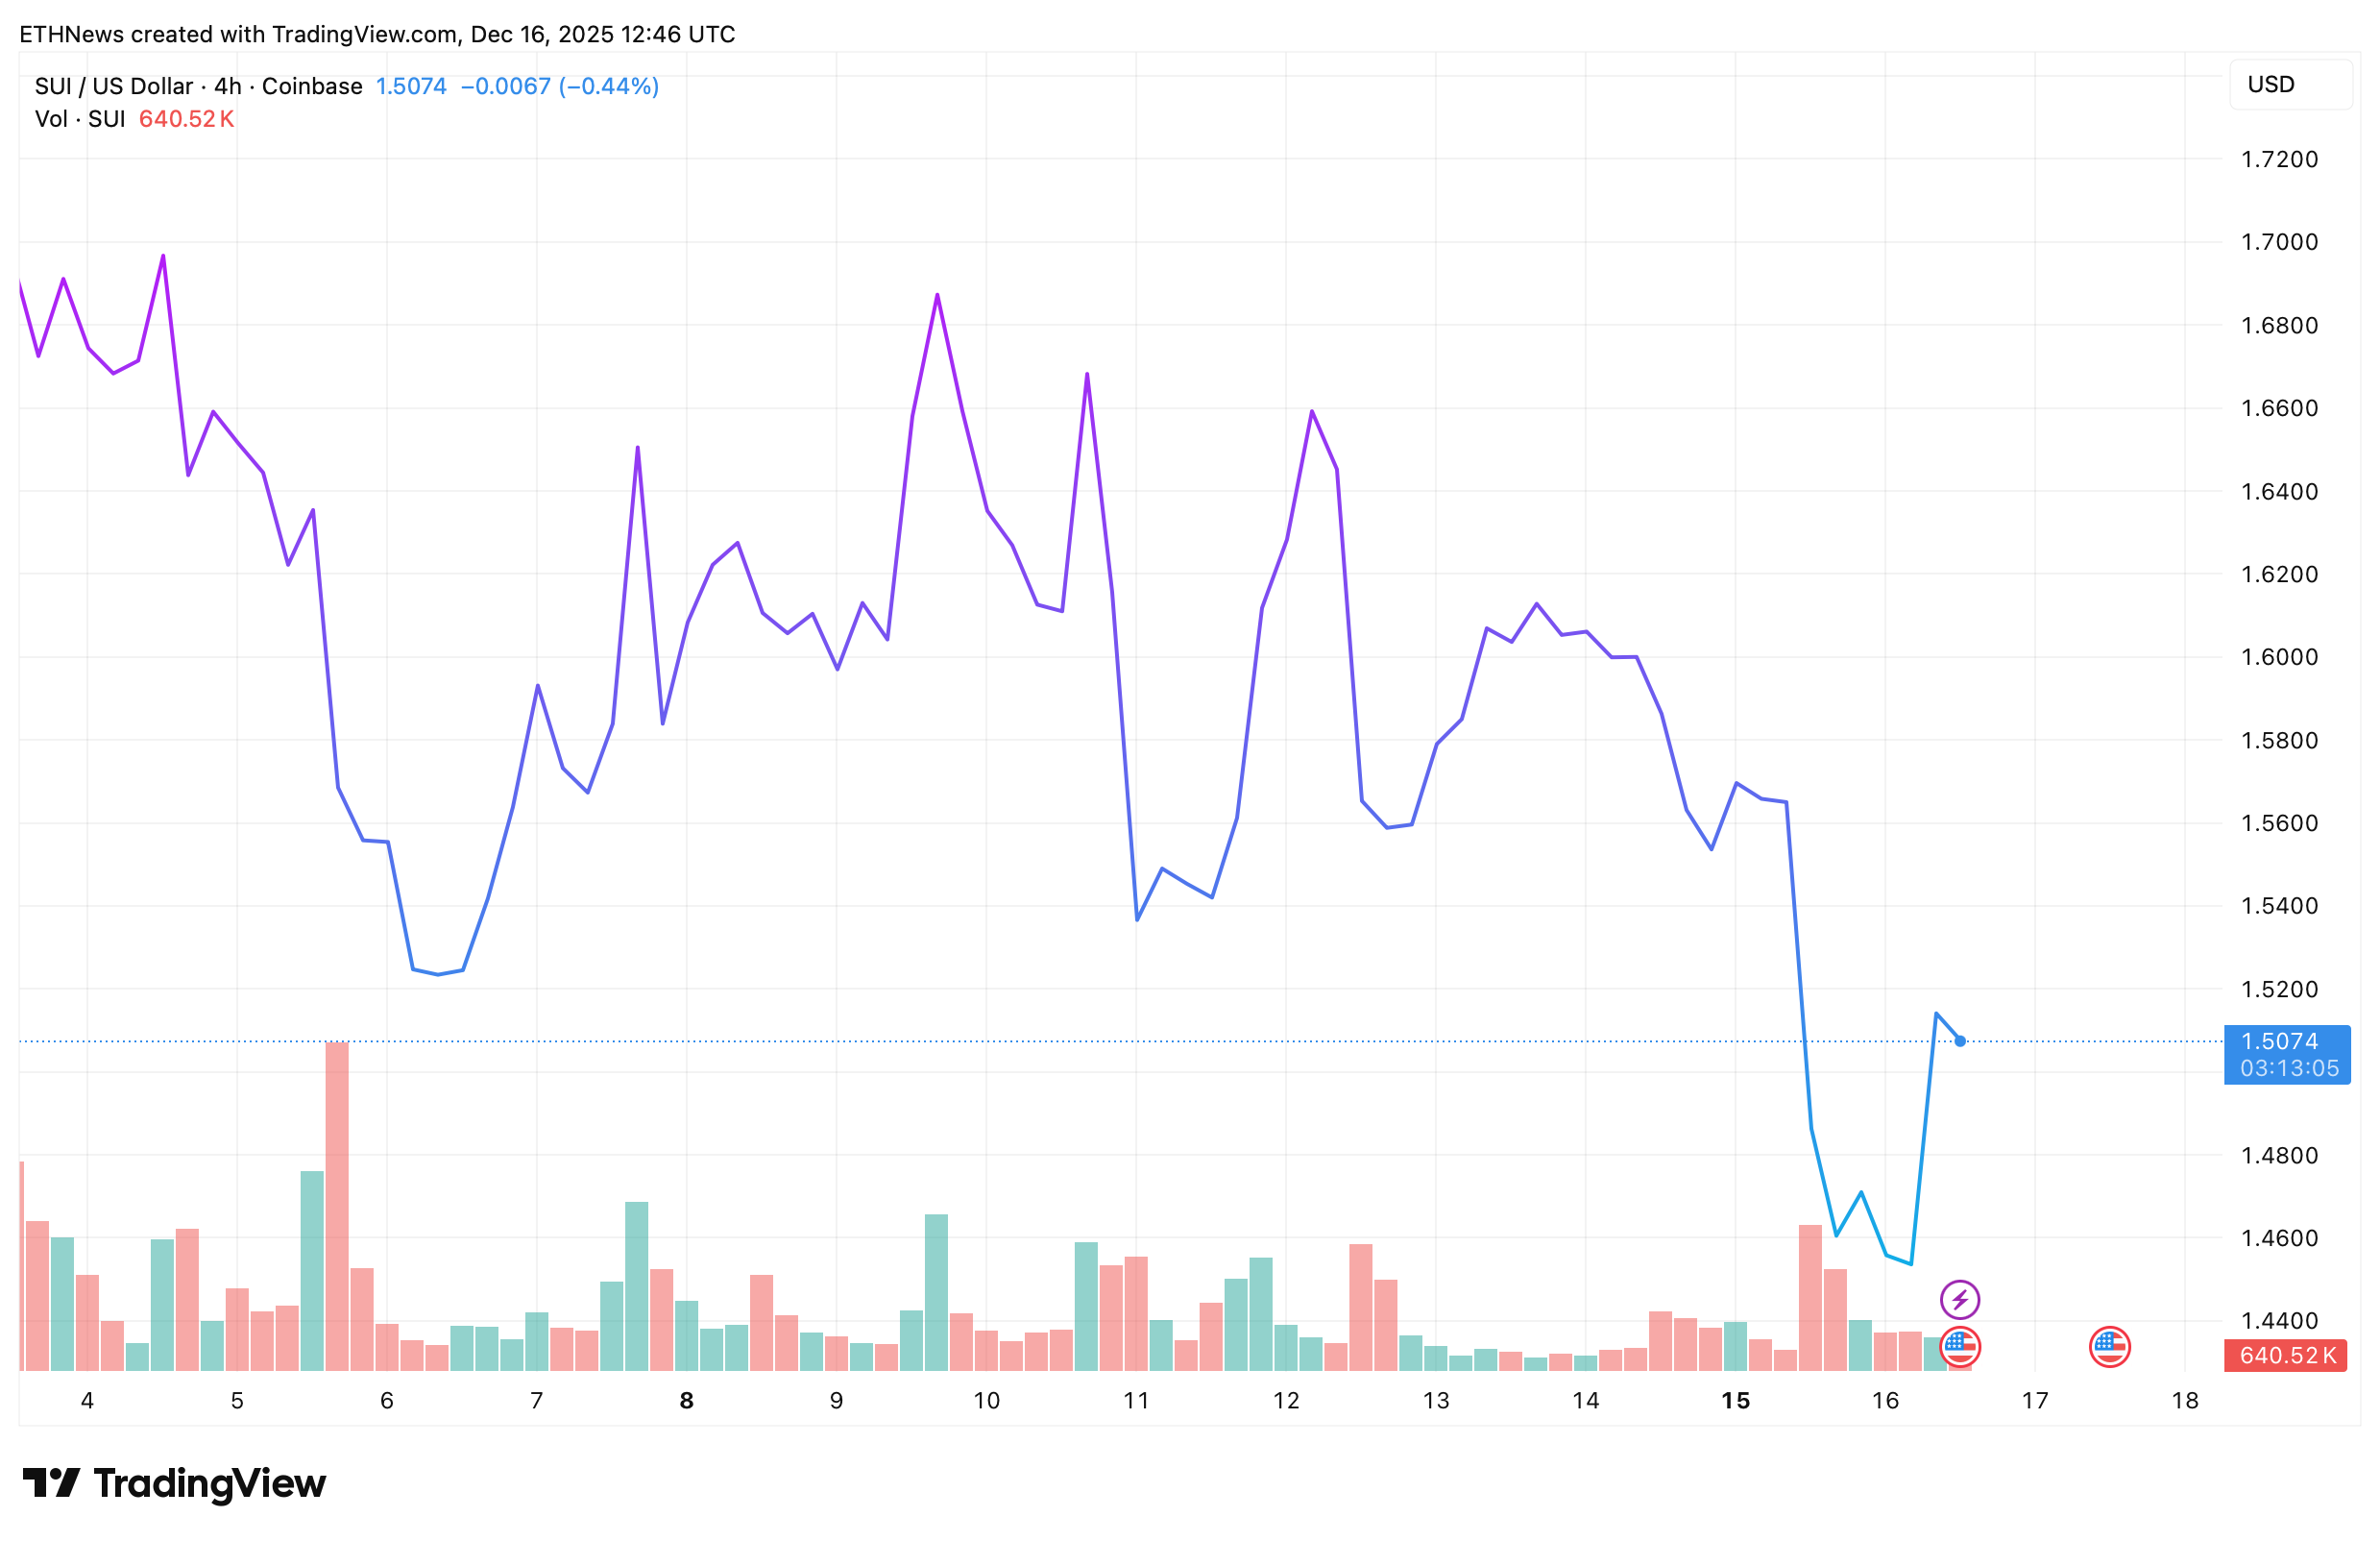
Volume spikes during sell-offs further support the idea that downside moves are being driven by active sellers rather than temporary volatility. Without a decisive reclaim of key resistance levels, downside risk remains elevated.
Sellers Continue To Control The Trend
As the structure stands, SUI remains locked in a bearish continuation setup. The inability to reclaim the falling resistance keeps the path of least resistance pointed lower, toward the highlighted target zone on the chart.
Until price action shows a clear structural shift, the technical outlook favors continuation rather than recovery, with sellers maintaining control of the trend.


