


- Stellar (XLM) surged to its January high of $0.515 after a 109% weekly rally but is now showing signs of a potential pullback due to bearish divergence and profit-taking.
Stellar (XLM) has made headlines once again after surging to match its January 2025 high of $0.515, following an explosive 109.7% rally in just one week. However, despite this impressive push, bulls are now facing exhaustion, and signs of a potential pullback are beginning to surface.
Price Hits Resistance at January Highs
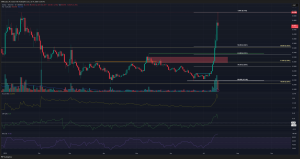
XLM’s meteoric rise brought the altcoin face-to-face with a critical resistance level at $0.515, the peak it last reached in mid-January. Although Stellar’s broader structure remains bullish, mirroring the overall momentum of the crypto market led by Bitcoin (BTC) and Ethereum (ETH), its failure to break decisively above this level has raised caution among traders.
On the 4-hour chart, a bearish divergence has emerged, indicating overextended market conditions. This divergence, where price continues rising but momentum indicators start declining, often signals a potential reversal or cooling-off period.
The Bigger Picture Remains Bullish
Despite short-term headwinds, Stellar’s weekly chart paints a clearly bullish narrative. Since the first structural break in May, the altcoin has posted a series of higher highs and higher lows. The recent move from $0.216 to $0.515 has only solidified this uptrend.
Even if XLM retraces from current levels, technical analysts suggest the bullish structure will hold firm as long as prices remain above $0.28. This makes any correction potentially healthy rather than bearish.
February High at $0.364: The Next Demand Zone?
Using Fibonacci retracement levels, the 50% retracement of the latest rally aligns perfectly with the February 2025 high at $0.364, making it the next logical support and demand zone. Traders eyeing entry points might consider this level ideal for buying if the price cools further.
Supporting this outlook, the Accumulation/Distribution (A/D) indicator has reached new highs, reflecting significant recent buying interest. Likewise, the Chaikin Money Flow (CMF) remains well above +0.05, confirming strong capital inflows.
High Volatility Ahead: Watch the Heatmap
CoinGlass’s liquidation heatmap reveals significant liquidity pockets below current prices, particularly between $0.445 and $0.395, suggesting that a swift drop into these zones could trigger forced selling. Meanwhile, above $0.51, another liquidity cluster suggests upside potential, if bulls can push through resistance.
In current conditions, consolidation is unlikely. Instead, the price is expected to gravitate rapidly toward these “magnetic” liquidity zones due to heightened speculative interest.
Stellar’s rally to $0.515 is a strong show of bullish momentum, but a cooling-off phase may be imminent due to technical overextension. A retracement toward $0.364 could offer a healthy reset before any move toward new highs. For now, traders should monitor liquidity zones closely and prepare for rapid price shifts rather than sideways movement.


