


Solana closed the week under clear selling pressure, with the latest price action signaling hesitation rather than conviction.
The chart shows SOL trading around $132, drifting sideways after Wednesday’s sharp drop and failing to produce any meaningful bounce. The move reinforces a trend that has dominated the past several sessions: lower highs, weak reactions, and continued seller control.
Chart Shows Persistent Weakness Around $132
On the 2-hour TradingView chart, Solana remains stuck in a narrow range between $131 and $134, following a rapid decline from the mid-$140s. The most notable structural point sits far below current price, the $126–$128 support zone, marked multiple times earlier in the week.
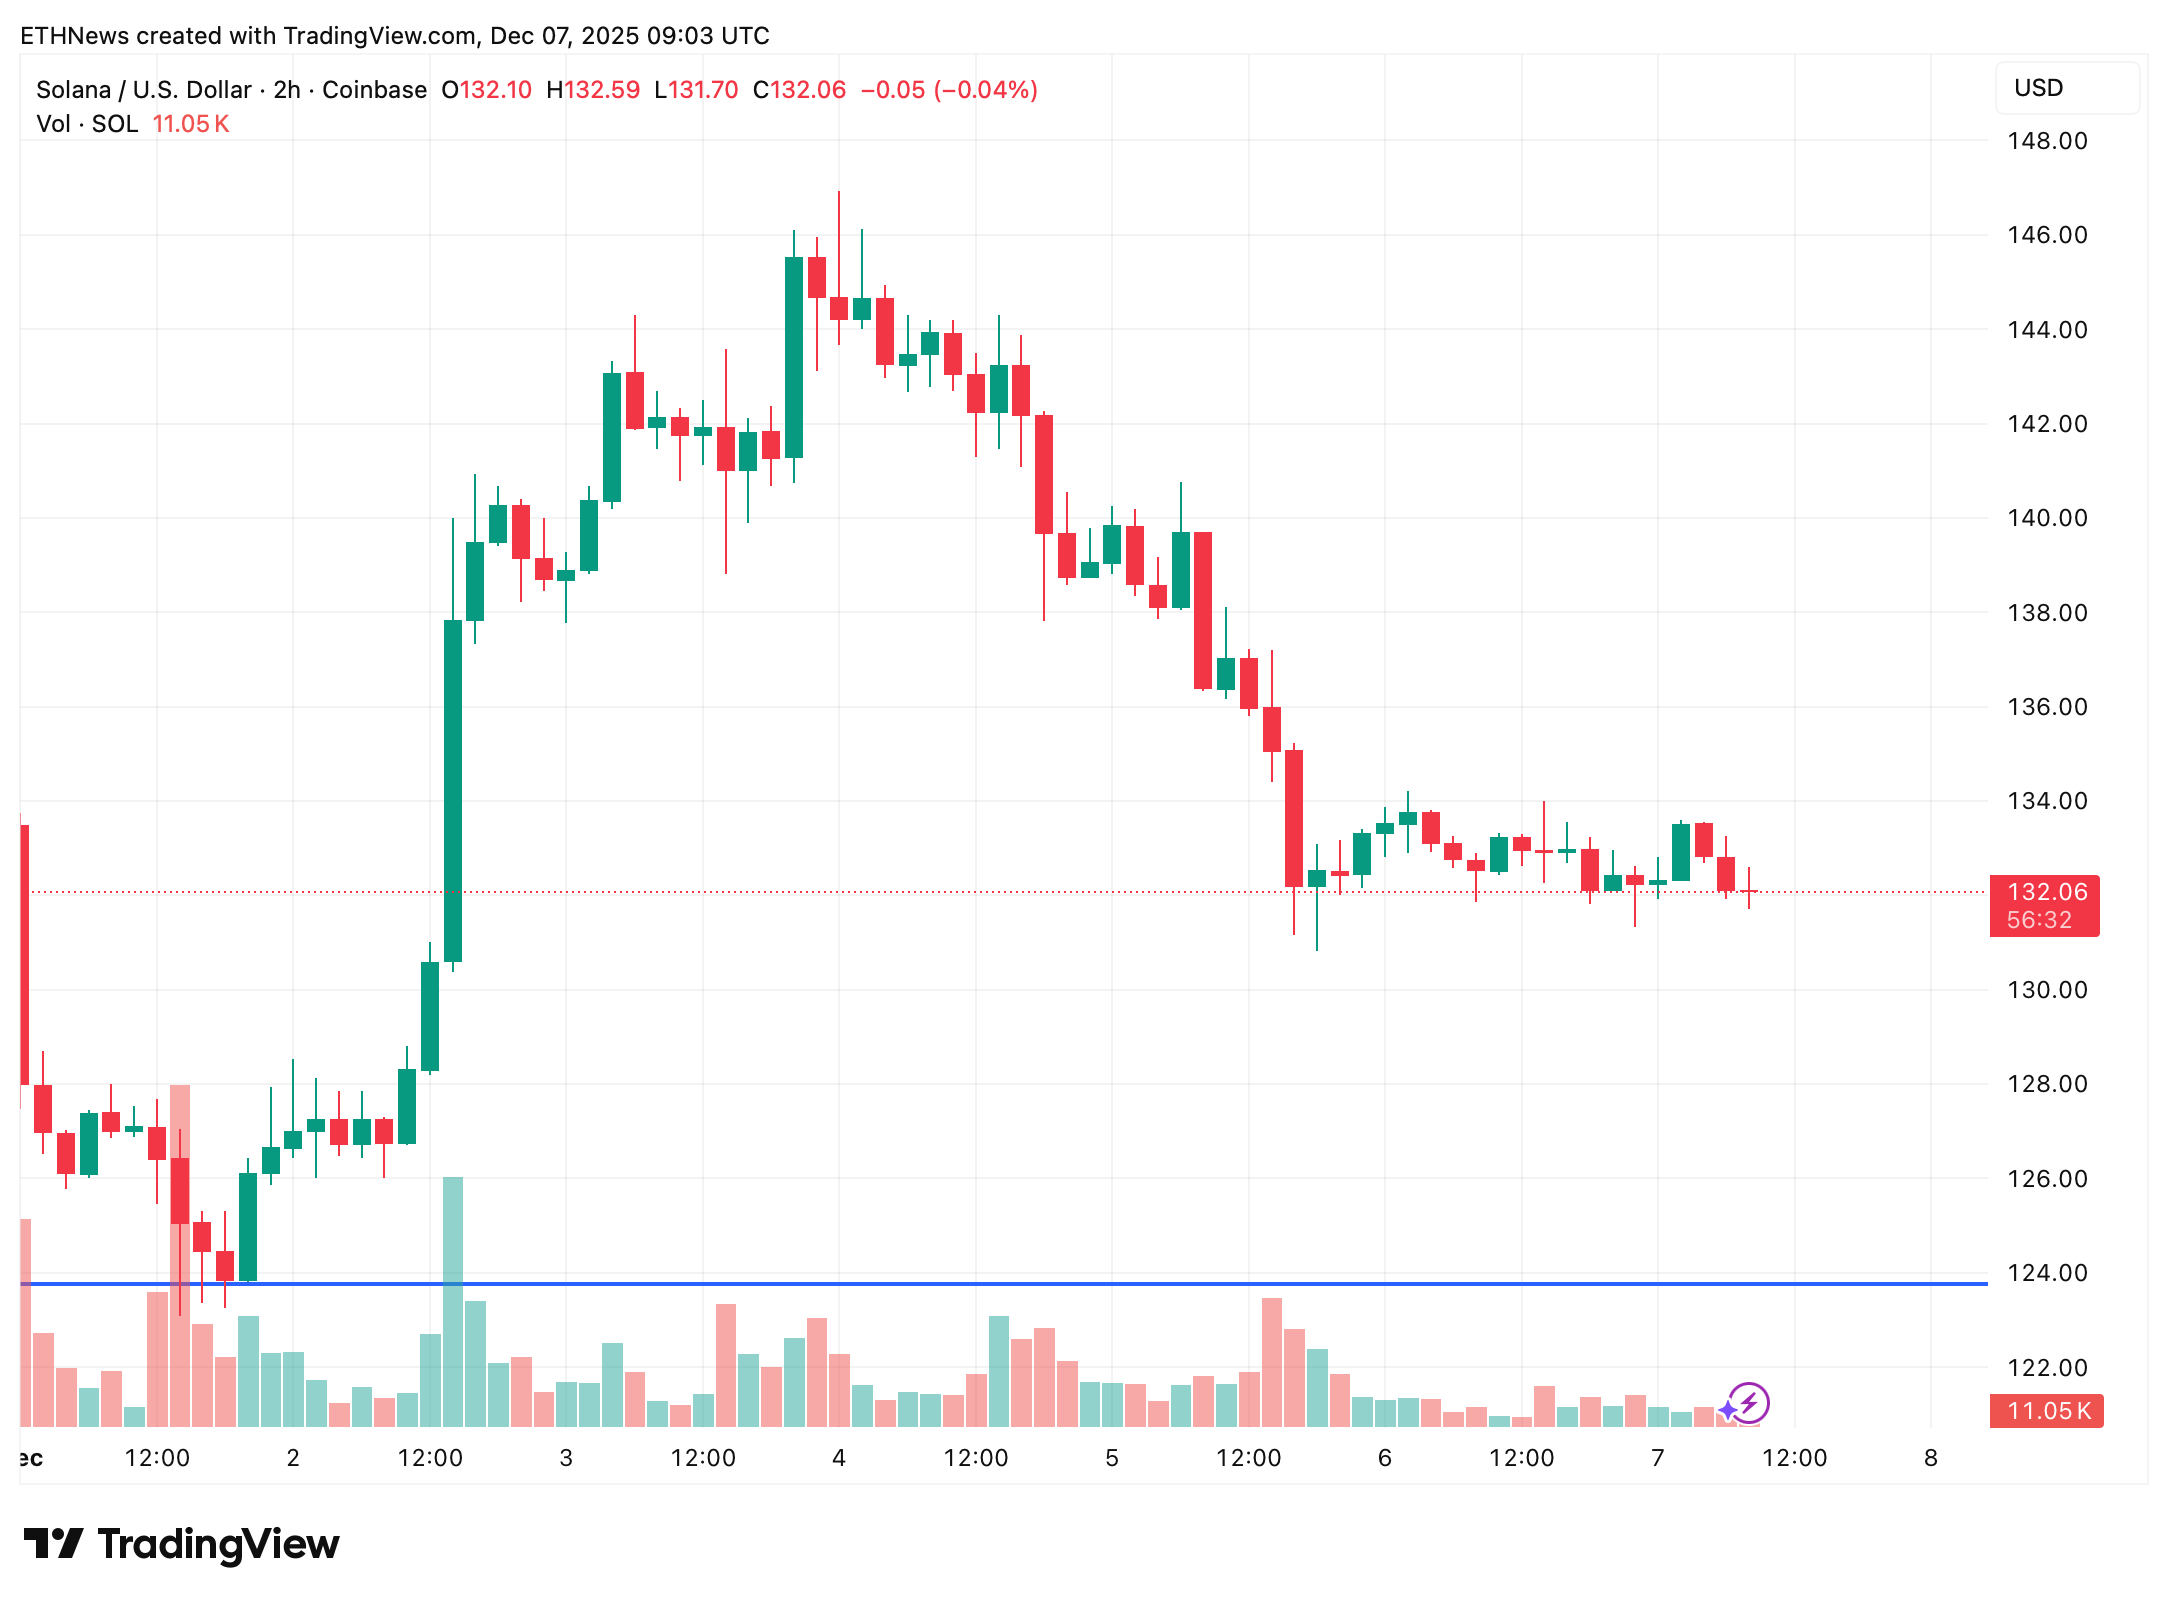
Volume has also cooled significantly, reinforcing how the market has shifted from momentum to caution. Despite attempts to stabilize, the candles lack follow-through, and every minor bounce continues to fade quickly.
Key Support: $126–$128 Remains the Battleground
MakroVision highlights the importance of the $126–$128 area, which aligns with the 0.786 Fibonacci level and previously absorbed liquidity during SOL’s last reactive dip.
That zone has now been tested twice, making it structurally significant, but also increasingly fragile.
A third retest would weaken it, and a confirmed breakdown could trigger a deeper move towards $115–$110, where the next liquidity pool sits.
Trend Still Bearish: No Shift in Market Structure Yet
The technical picture remains firmly bearish:
- Lower highs define the structure
- Counter-rallies are shallow
- Sellers still dominate the tape
- Momentum indicators (via candle strength and volume) show no impulse
The recent bounce from support is classified as corrective, not impulsive, meaning it lacks the characteristics of a true reversal.
MakroVision notes that as long as SOL remains below the two declining red trendlines, the market is locked in downward pressure. Current price action on the chart confirms this, with every attempt at recovery stalling quickly.
What Needs to Happen for a Bullish Recovery?
The upside remains conditional and currently not confirmed:
- A move back above $159.39 would be the first meaningful recovery signal
- Only then could Solana begin targeting higher zones like $188–$204
- Until that happens, any bounce remains suspect and vulnerable to reversal
With the chart showing SOL far below that threshold – pinned near $132 – the bullish path remains distant.
Conclusion
Solana enters the new week sitting on uncertain ground. The chart shows stabilization, but not strength. MakroVision’s assessment aligns completely with the current price structure: the trend is still bearish, the support zone at $126–$128 is crucial, and the broader market remains under pressure.
Unless buyers quickly reclaim the descending trendlines and later the $159 marker, the risk of another leg lower stays elevated, and a drop into $115–$110 cannot be ruled out.


