


Solana has spent most of November under heavy pressure, but new data suggests the trend may be shifting. The asset is trading around $127, extending a multi-week decline that pushed SOL nearly 50% below its September peak. Yet, despite the drawdown, fresh on-chain metrics and short-term forecasts indicate early signs of improving momentum.
Solana Price Prediction Points to Short-Term Recovery
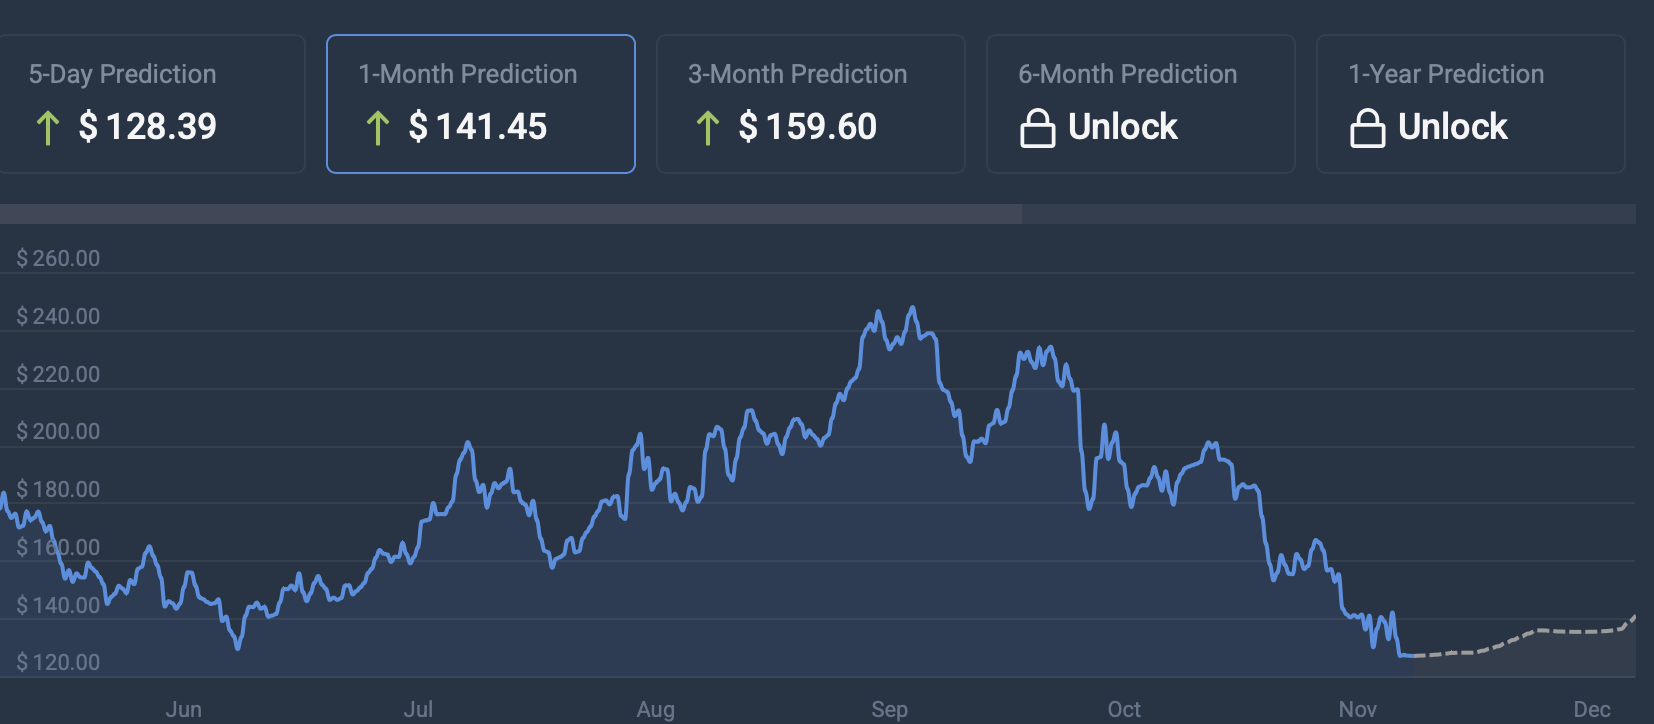
According to data, Solana’s short-term technical outlook is slightly more optimistic than market sentiment implies. CoinCodex’s 30-day model projects a move toward $141.45, roughly 10.83% above the current $127 level.
SOL remains in a high-volatility phase at 13.47%, while both the 50-day SMA ($179.43) and 200-day SMA ($174.92)sit far above spot price, signaling a broader downtrend.
The Fear & Greed Index reading of 11 (Extreme Fear) reflects capitulation-like conditions, typically seen near local bottoms.
Meanwhile, RSI at 31.19 suggests the asset is approaching oversold territory, strengthening the probability of a corrective bounce.
Santiment: “Unique Bullish Divergence” Emerges
Fresh on-chain data from Santiment highlights an important divergence forming across Solana’s network activity. Despite SOL’s -49% decline from the September 17 high, Santiment notes:
- Daily active addresses are rising
- Newly created SOL wallets are trending up
- Interaction levels with the network are increasing
📊 Solana's market value has now fallen -49% from its local top back on September 17th. However, there has been a unique bullish divergence with crypto's #7 market cap. The amount of interacting addresses are rising, and new $SOL wallet creation is trending up.
🔖 Follow the… pic.twitter.com/qHajp1dlV8
— Santiment (@santimentfeed) November 22, 2025
The analytics firm calls this a “unique bullish divergence” for the #7 crypto by market cap, meaning activity is improving even as price weakens. Historically, such patterns often precede a momentum shift once selling pressure cools.
The accompanying chart shows a long downtrend in address activity breaking upward, with new addresses rising even as price continues falling, a classic early-cycle reversal signal.
TradingView Chart Shows Heavy Selling Followed by Volume Expansion
The 4-hour TradingView chart reveals a clear downtrend from early November, but the final 48 hours show a noticeable spike in trading volume.
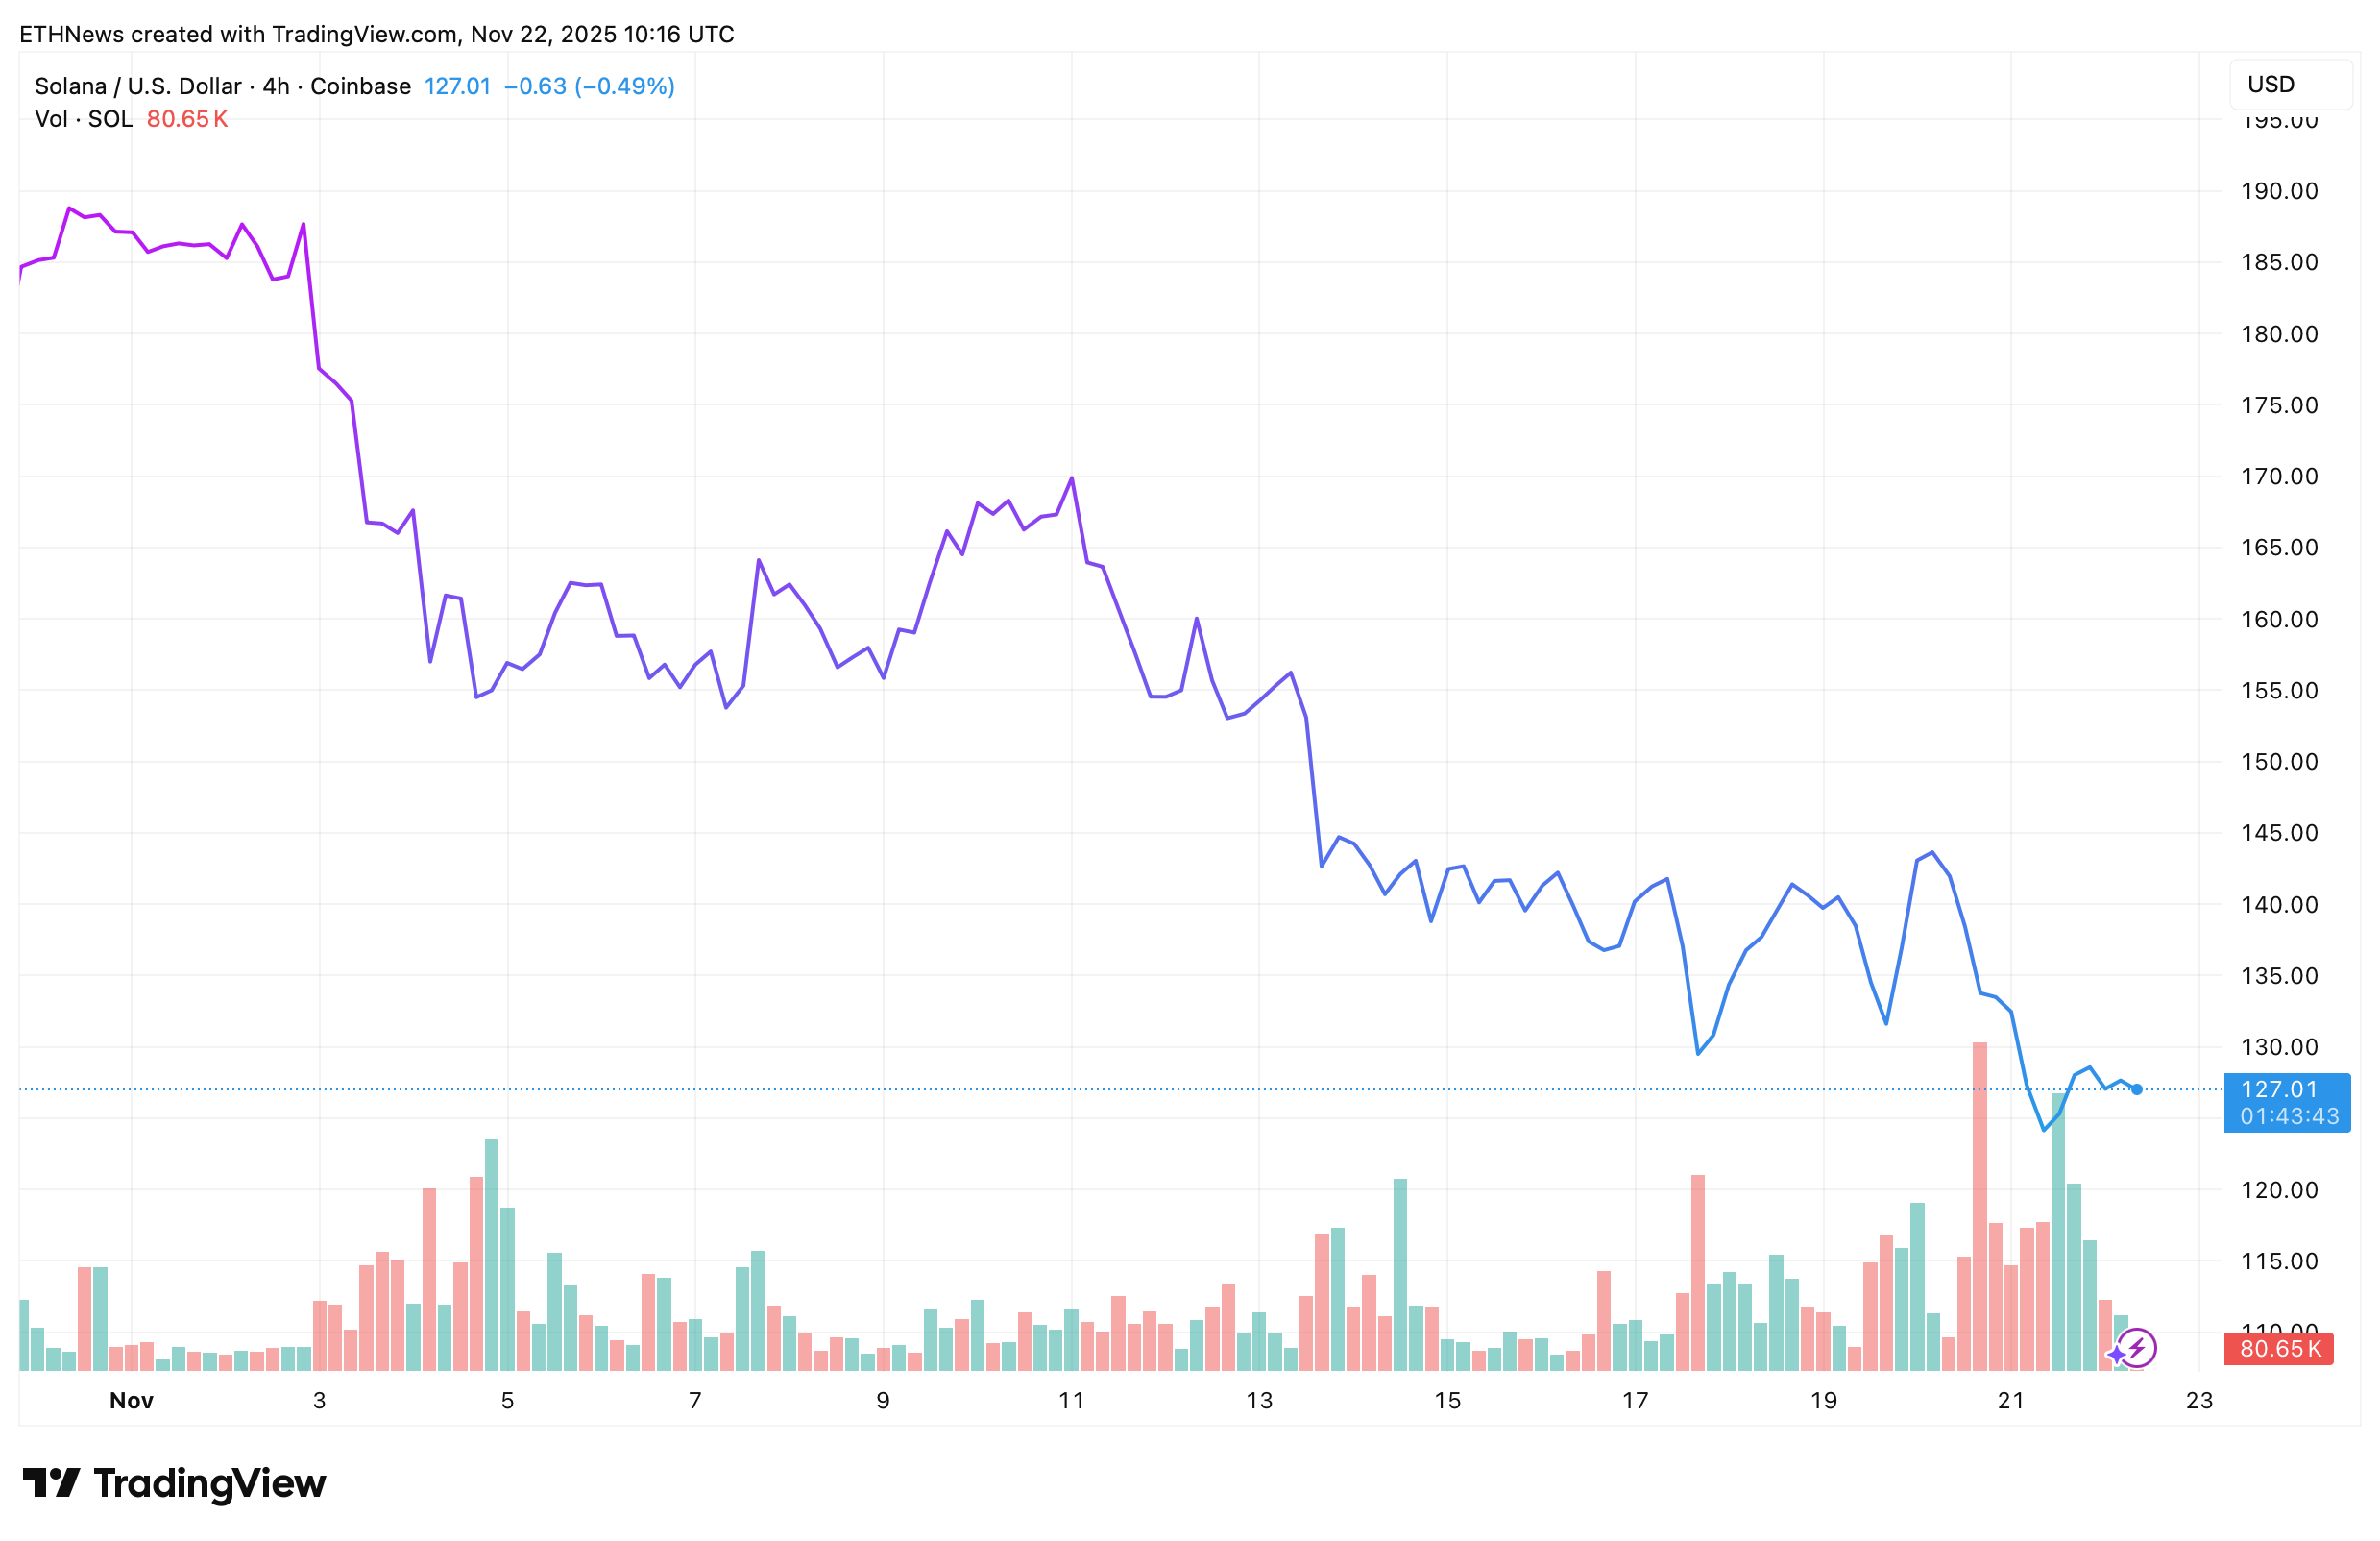
Buyers stepped in aggressively around the $120–$125 zone, producing several large green candles that helped stabilize price near its current level.
This lower-timeframe behavior suggests liquidity is returning after a prolonged seller-dominated period.
Outlook
Solana remains under macro technical pressure, but the combination of on-chain strength, oversold technicals, and a short-term CoinCodex price target of $141.45 gives traders a reason to watch the asset closely.
If address growth continues to accelerate while volume stays elevated, SOL could attempt a corrective rally toward the mid-$130s and possibly the predictive $141 level in the weeks ahead.


