


Solana has entered a structurally vulnerable phase after breaking below a long-developing weekly head-and-shoulders pattern, a formation that has been building for nearly two years.
The breakdown coincided with a broader market selloff and accelerated as price lost a major horizontal support zone.
With both higher-timeframe structure and short-term momentum aligned to the downside, the focus has shifted from consolidation to damage control.
Weekly Structure Gives Way After Two-Year Formation
The weekly chart highlights a clear head-and-shoulders pattern, with the left shoulder, head, and right shoulder all cleanly defined. The neckline, drawn across the $95–$100 region, acted as a long-term support area before finally giving way during the recent selloff.
$SOL Head & Shoulders Breakdown on the Weekly 📉💥
It has been 2 years that SOL is printing this macro H&S pattern. ✅
Price recently broke down below the neckline on this recent sell off, which could open the door to lower prices on $SOL.#Solana pic.twitter.com/mNQRYeRCbE
— Bitcoinsensus (@Bitcoinsensus) February 6, 2026
Price has now decisively moved below that neckline, confirming a structural breakdown rather than a temporary deviation. Once acceptance occurred beneath this level, downside pressure expanded quickly, consistent with a completed macro pattern.
This is the first sustained loss of that support zone since the broader uptrend began.
Short-Term Price Action Confirms Acceptance Below Support
On the 1-hour SOL/USDT chart, Solana is currently trading around $81, after an aggressive selloff from the $120–$125 area earlier in the week. The move lower was sharp and directional, with minimal consolidation during the decline.
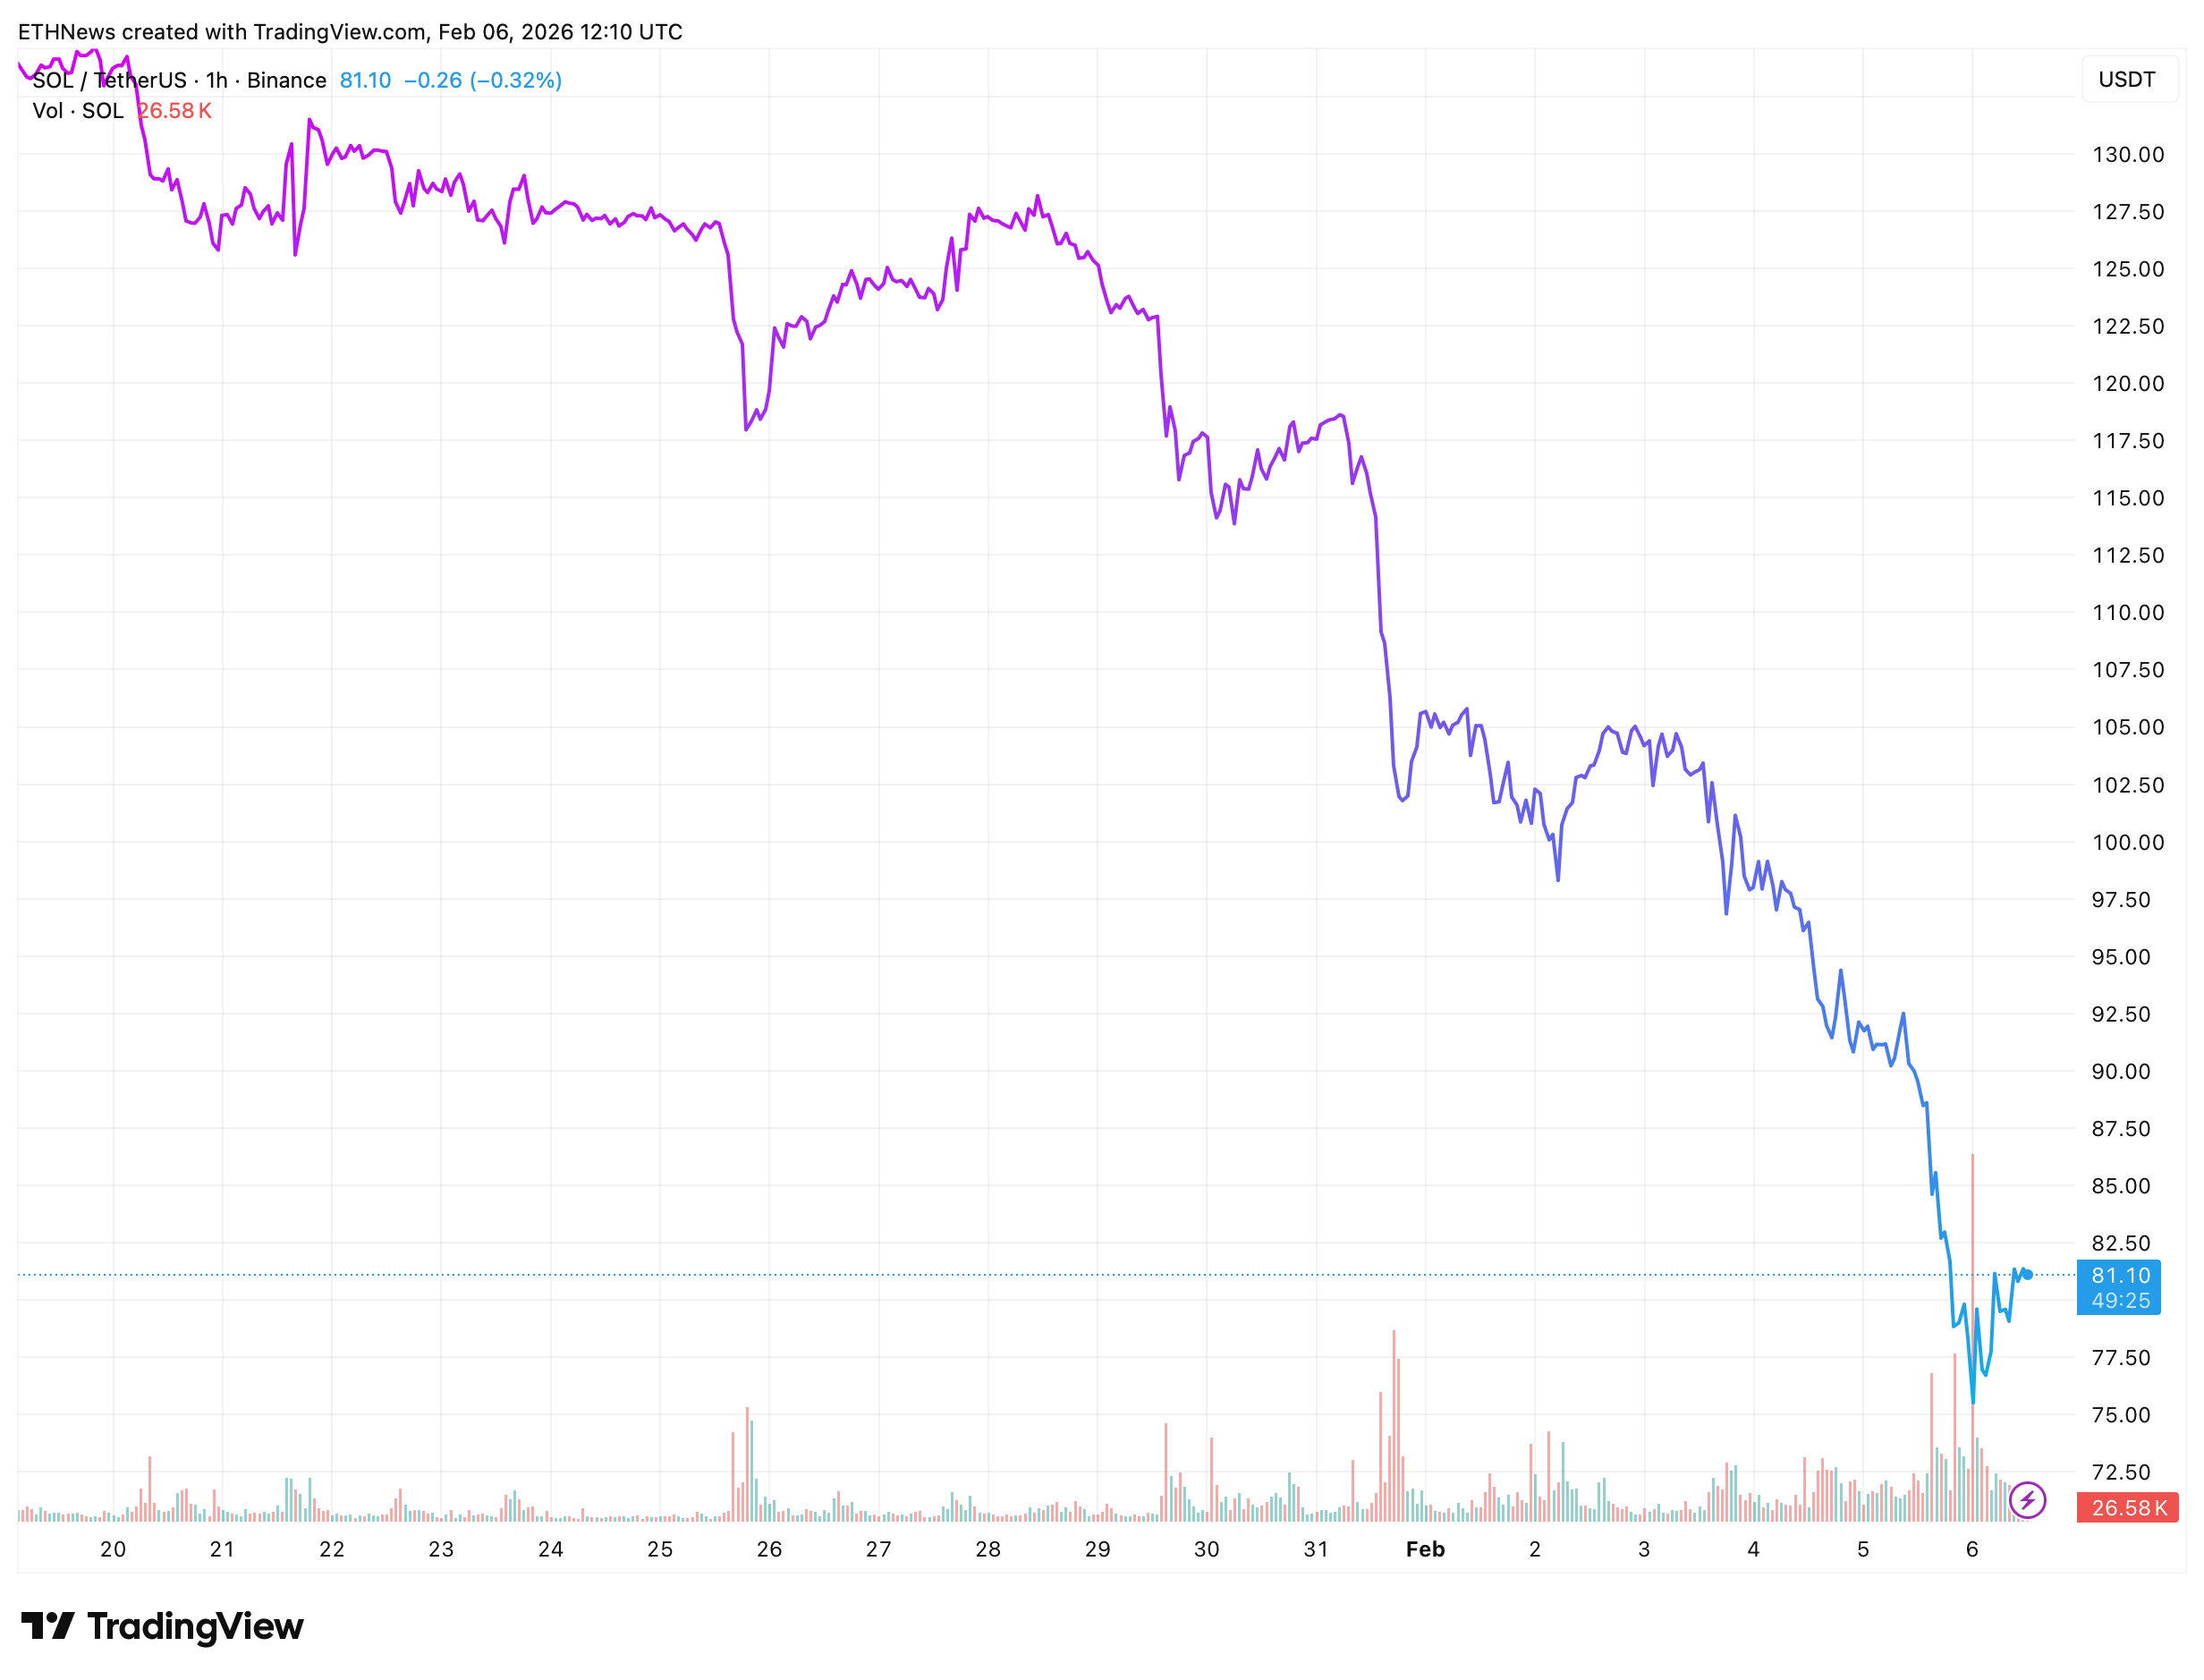
After briefly flushing into the mid-$70s, price has rebounded modestly but remains well below former support. The rebound so far lacks follow-through and has not reclaimed any prior breakdown levels, suggesting the move is corrective rather than impulsive.
Key Levels Now Defined by the Breakdown
With the neckline lost, former support has transitioned into resistance:
- Resistance: $95–$100 (former neckline zone)
- Intermediate resistance: $85–$88 (local reaction area on the rebound)
- Current price: ~$81
- Local support: $75–$78 (recent downside reaction)
As long as price remains below the $95–$100 zone, the weekly structure remains invalidated. A sustained move back above that range would be required to negate the breakdown and shift structure back into a neutral state.
Momentum Shift Is Structural, Not Just Volatility
The alignment between the weekly breakdown and the lower-timeframe acceleration suggests this move is driven by structural acceptance rather than isolated volatility. The sharp expansion lower followed immediately after the neckline failed, reinforcing the significance of the level.
Volume on the intraday chart increased during the selloff, consistent with distribution rather than a low-liquidity wick. That behavior supports the idea that sellers are active below former support.
What Needs to Change From Here
For downside pressure to ease, Solana would need to reclaim broken structure rather than simply bounce:
- Acceptance back above $85–$88 would be the first sign of stabilization
- Reclaiming $95–$100 would be required to challenge the weekly breakdown
- Failure to reclaim those zones keeps risk skewed toward further consolidation or continuation lower
Until that occurs, rallies are technically counter-trend within a confirmed breakdown structure.
Structural Takeaway
Solana’s loss of a two-year weekly head-and-shoulders neckline marks a meaningful shift in market structure. With price currently trading near $81 and holding below former support, the burden of proof has moved firmly to the upside.
For now, structure favors caution, with confirmation dependent on whether price can reclaim the broken neckline rather than simply react from oversold conditions.


