


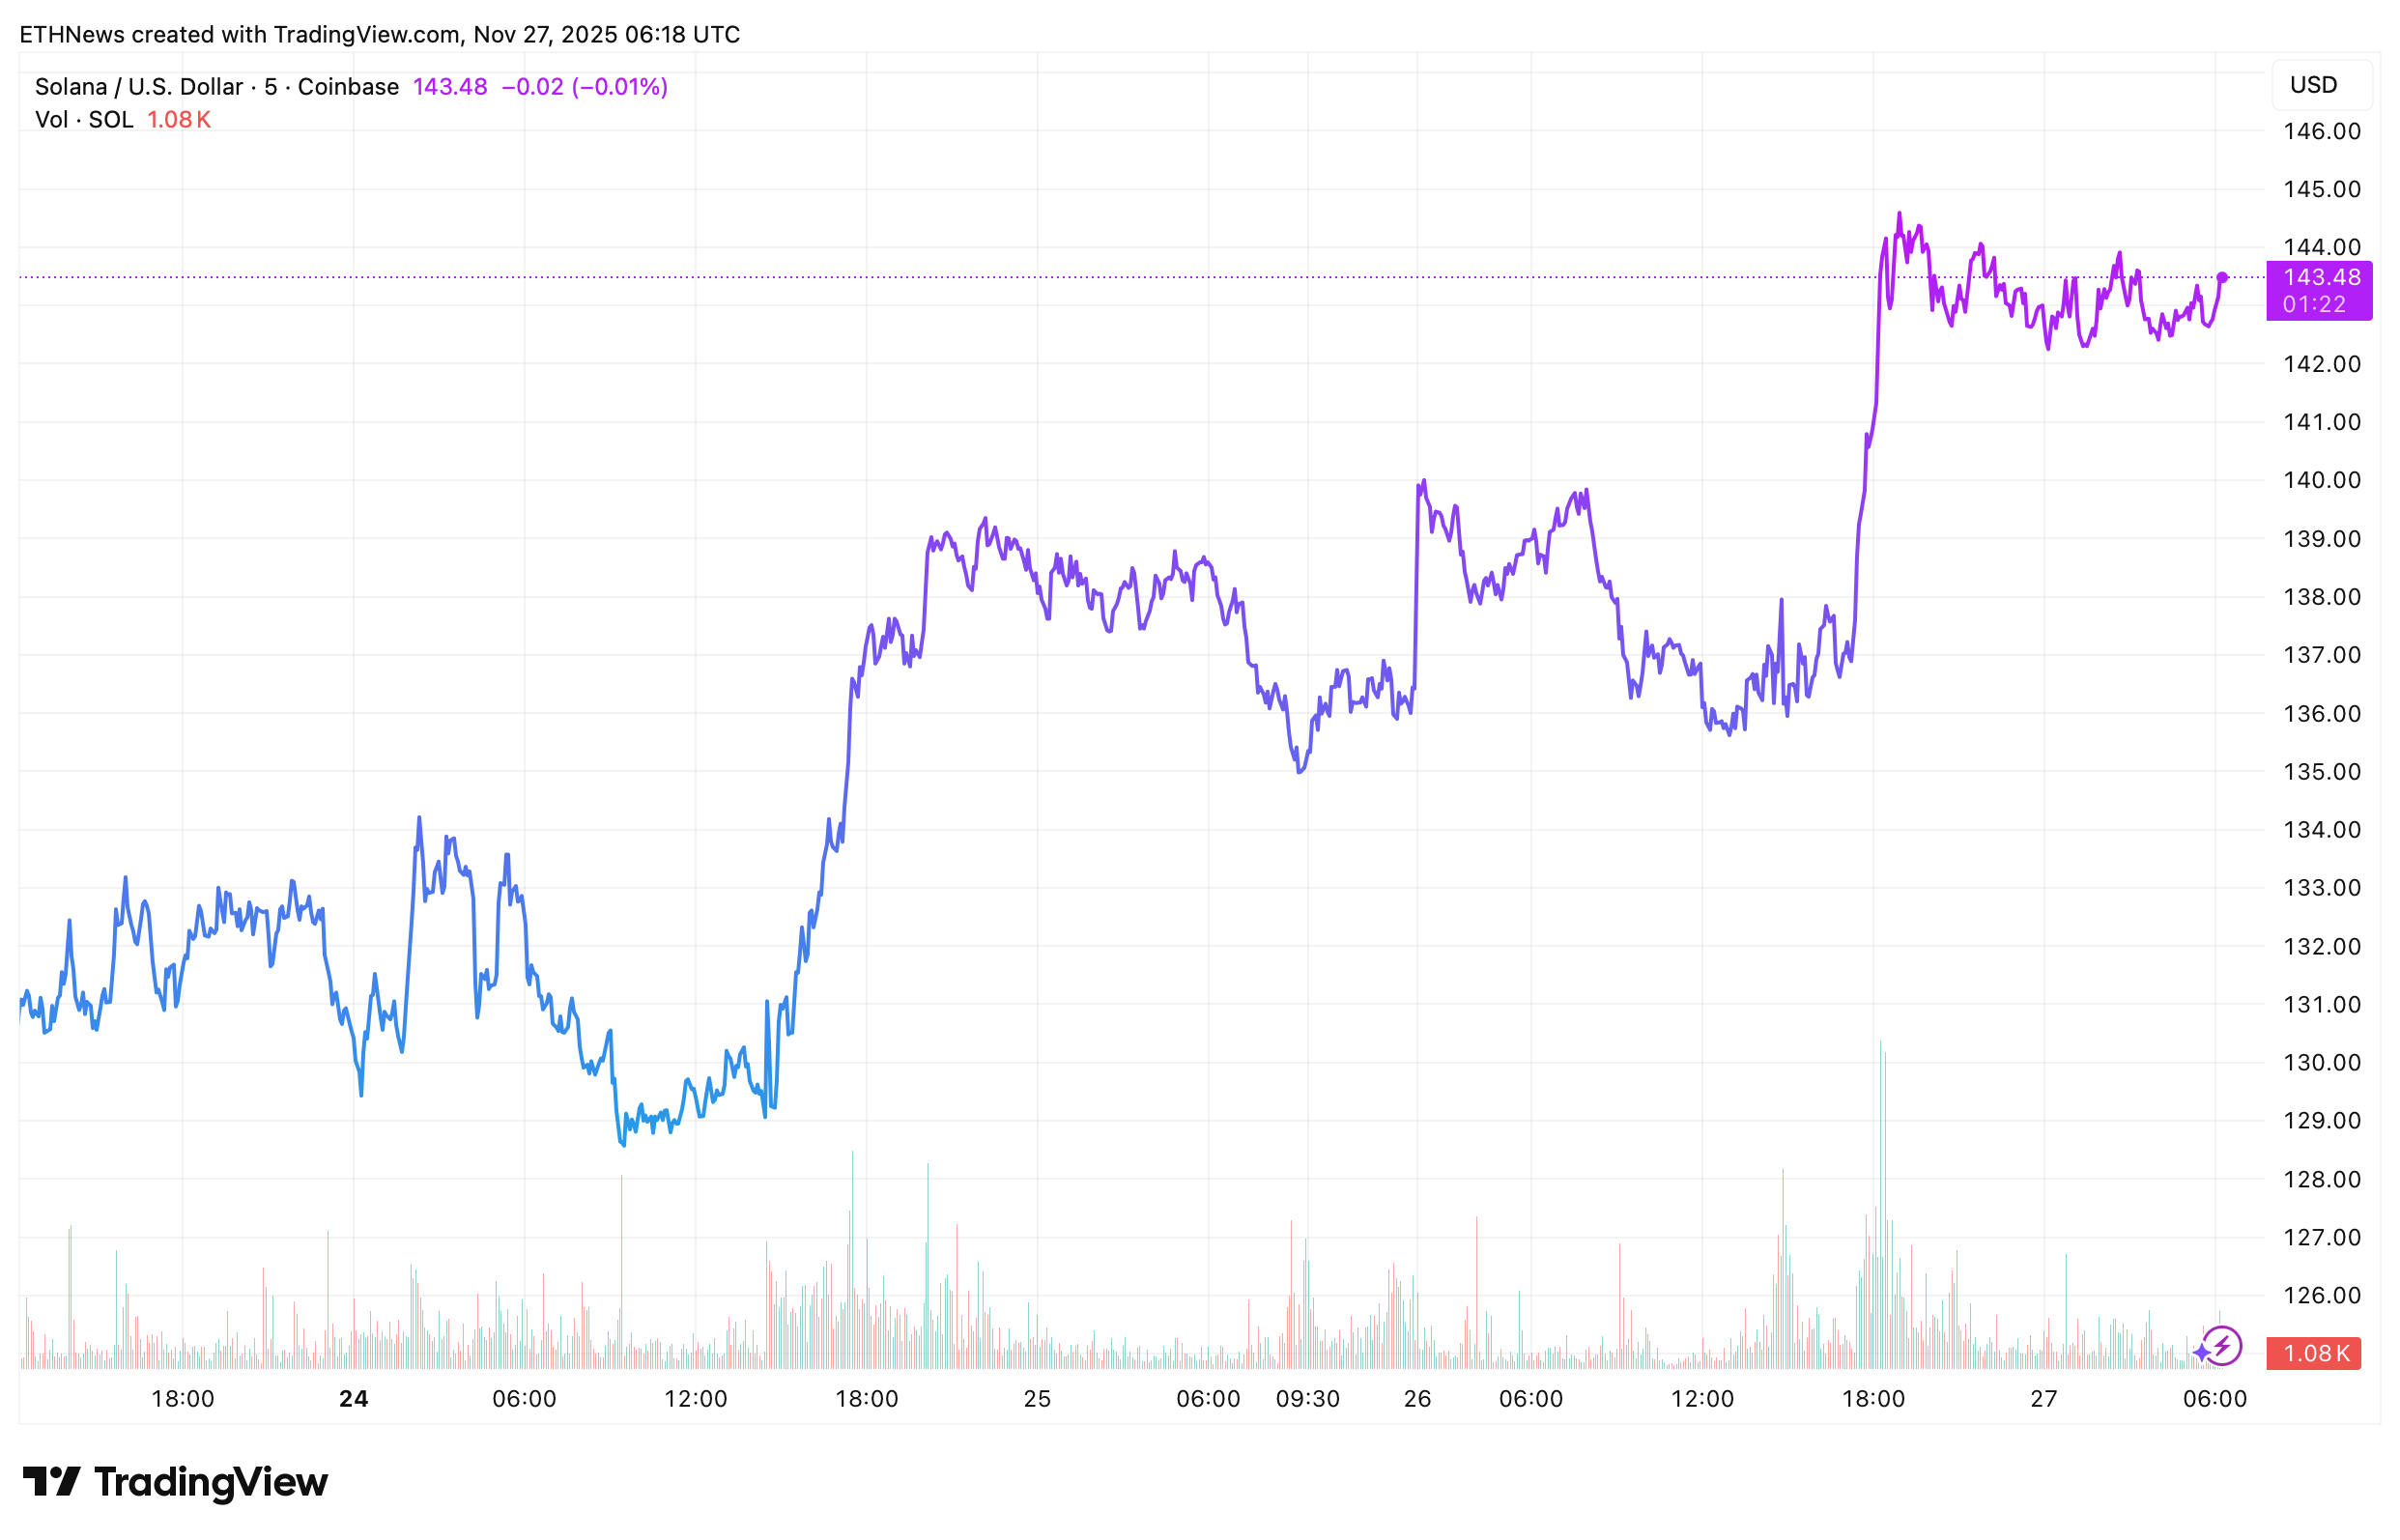
Solana is trying to stabilize after several difficult weeks, with the price now trading around $143.48 following a sharp rebound from the $130 area. The latest TradingView chart shows SOL pushing back above a crucial high-timeframe demand zone, offering the first constructive price action since the recent market-wide downturn.
Despite broader bearish sentiment, traders have begun reassessing Solana’s setup as the price holds steady above support and volatility cools, while early activity from SOL-based meme tokens has added a small spark of renewed interest.
A Closer Look at the Chart Structure
The mid-week chart highlights a clean bounce from Solana’s multi-month support band, followed by a rapid recovery into the $142–$144 range. This reaction came exactly at a level that has served as a demand zone throughout the past two years, an area where buyers consistently defended price.
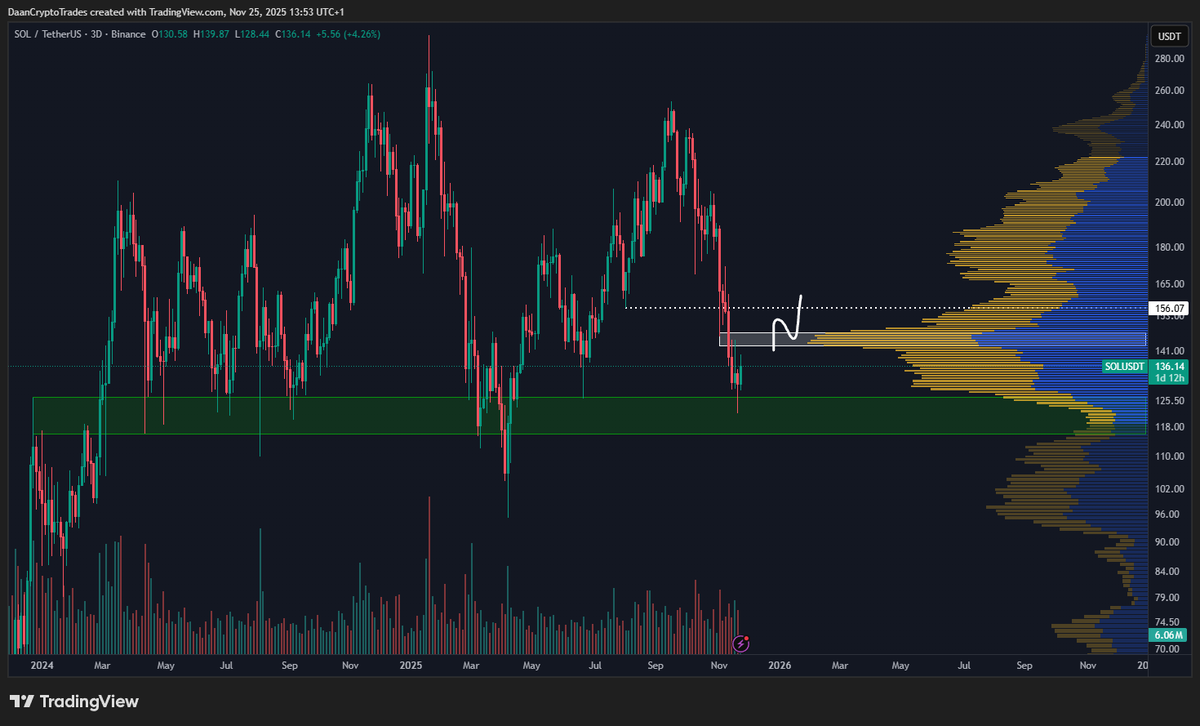
The volume profile shared by DaanCrypto shows the $145 region acting as the high-volume node, meaning it’s the most traded, and therefore most contested, area for Solana. Price is currently sitting just beneath that line, attempting to reclaim it after the latest breakdown.
Technical indicators reinforce the mixed picture. Solana trades well below both its 50-day SMA ($171.55) and 200-day SMA ($174.55), signaling that the broader trend is still under pressure. At the same time, the RSI at 41.36 indicates neutral momentum rather than active selling, aligning with the recent stabilization on the intraday chart.
DaanCrypto: “$145 Is the First Barrier, $155 Comes Next”
Analyst DaanCrypto highlighted that Solana’s slump may be reaching an exhaustion point. In his breakdown, he emphasizes that the price now sits at major high-timeframe support and that the first step toward recovery is reclaiming $145.
If SOL manages to break above that level and hold it, the next significant area on the chart lies near $155, which corresponds to the next liquidity pocket on the volume profile. This level also aligns with previous consolidation from earlier this year.
Daan notes that price has shown its “first signs of life,” and that the next few weeks will determine whether SOL can build actual momentum from this position.
What Comes Next for SOL
Solana’s recovery attempt hinges on whether bulls can defend the $140–$145 region. Hold it firmly, and a push toward the mid-$150s becomes realistic. Lose it again, and the chart likely revisits the deeper green zone highlighted in the analysis—an area around $125–$130 where buyers stepped in recently.
For now, SOL is positioned at one of its most important technical levels of the entire year, and traders will be watching closely to see if this bounce develops into something more substantial.


