


After an extended sell-off, Solana (SOL) has reached a price area that historically forces the market to reveal its hand.
According to technical analysis shared by crypto trader GainMuse, the asset is now testing a long-term structural demand zone following months of declining momentum and repeated breakdowns from consolidation.
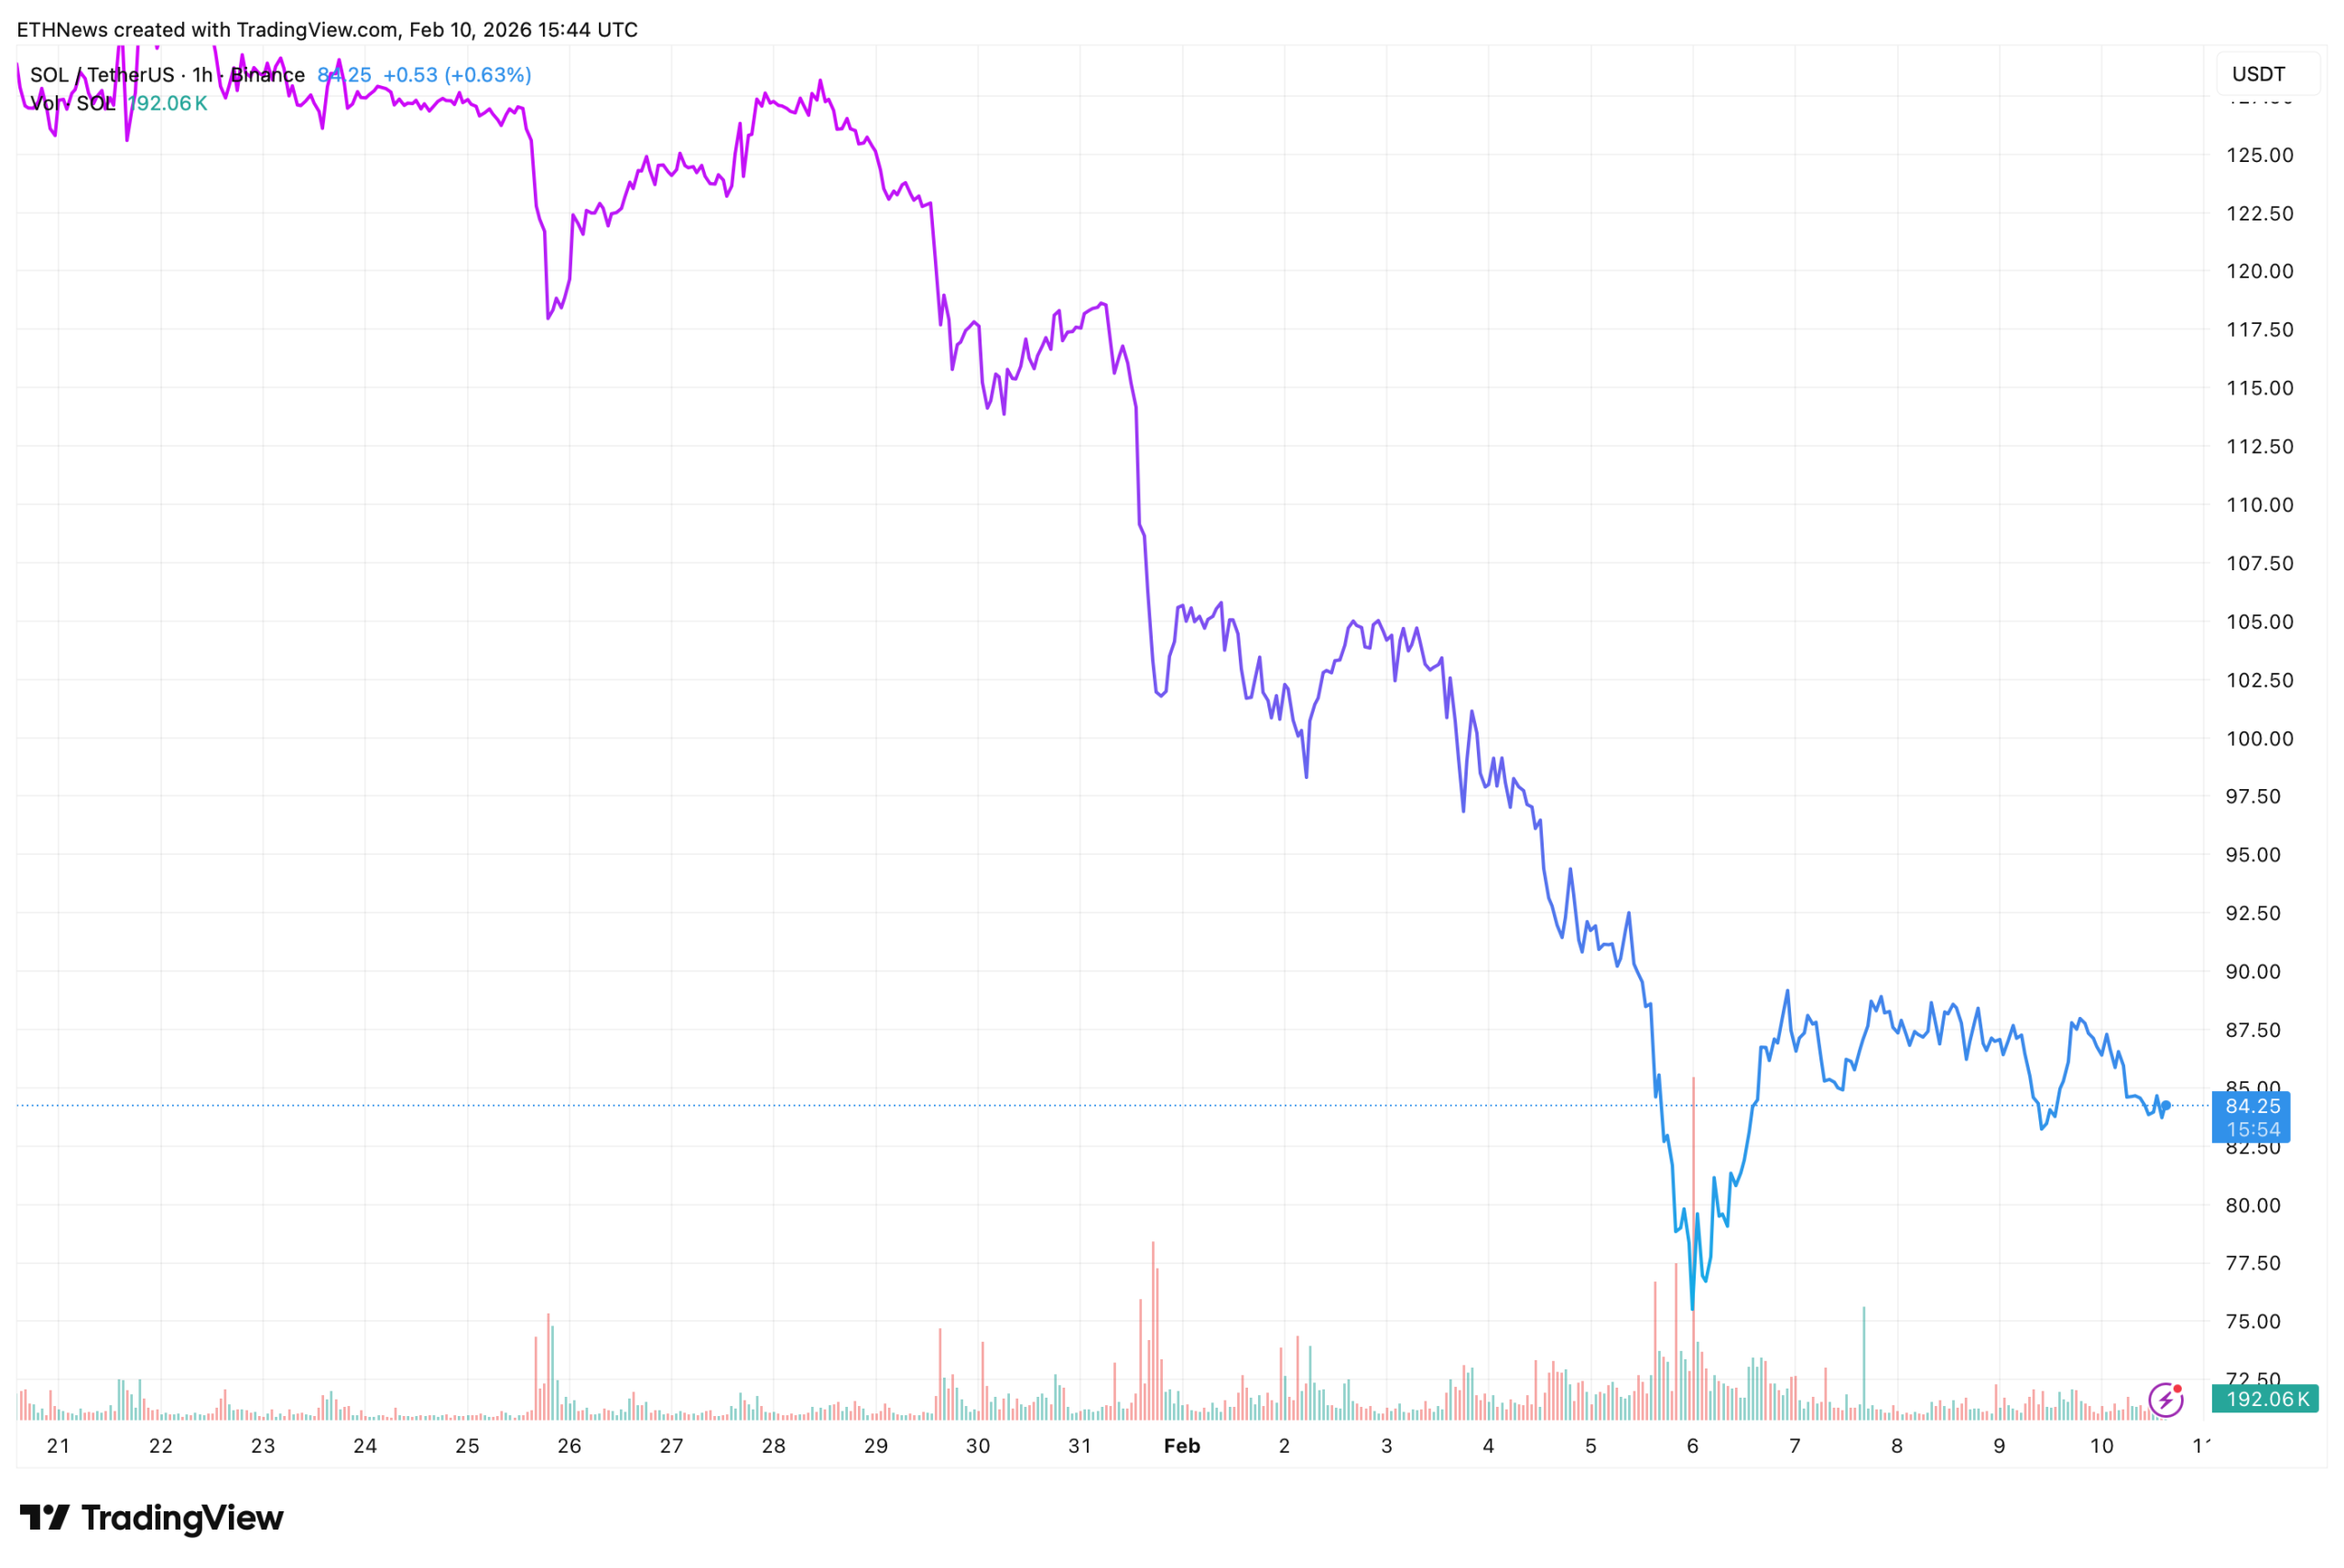
At the time of writing, SOL is trading near $84, stabilizing after a sharp downside move that accelerated through multiple former support zones. The current price behavior suggests the market has entered a decision phase rather than a continuation of the prior impulse.
Structural Breakdown Leads Into Long-Term Demand
GainMuse’s chart highlights a sequence of failed recoveries, where each bounce was capped by descending resistance. This structure ultimately resolved lower, pushing SOL into a long-term ascending support trendline that has historically acted as a reaction area.
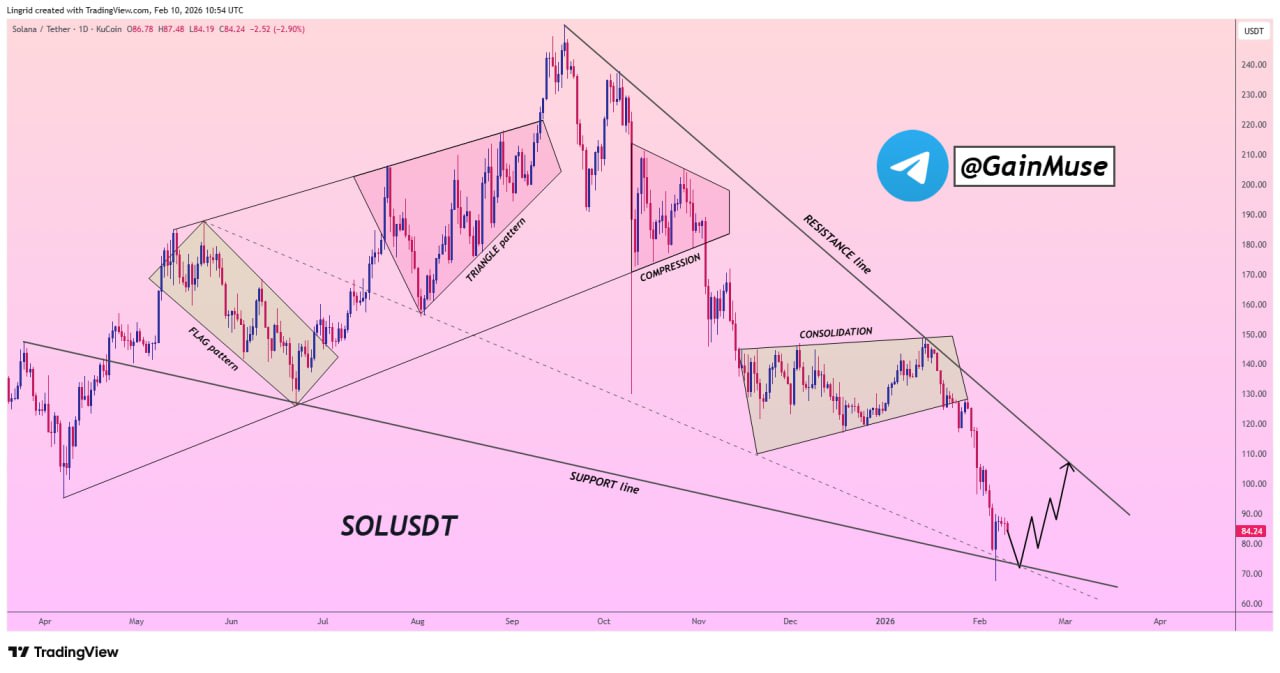
The breakdown from consolidation confirms broader weakness, but selling pressure appears to be slowing as price approaches this structural base. The visible compression and reduced downside follow-through suggest that aggressive sellers may be losing control near current levels.
As long as SOL holds above the $80–$85 region, the market remains technically positioned for a stabilization phase rather than immediate continuation lower.
Short-Term Price Action Shows Exhaustion Signals
The accompanying price chart shows SOL bottoming near $78–$80 before rebounding back toward $84, followed by tight consolidation. Volume expanded during the initial sell-off, then faded as price stabilized, a pattern often associated with seller exhaustion rather than fresh distribution.
From a structural perspective, this area represents the last visible demand zone before price would enter a lower range not tested in the current cycle. Failure to hold this base would expose SOL to deeper downside, while sustained acceptance above it opens the door to a technical rebound.
What the Market Is Watching Next
If the current demand zone holds, Solana could attempt a corrective move toward the descending resistance region near $95–$100, where previous breakdowns occurred. That level remains the first major test for any recovery attempt and would determine whether the move is corrective or structural.
Until then, price behavior around $84 remains pivotal. This zone is now the line separating continuation from potential reversal, making it one of the most important technical areas for Solana in the near term.


