


- Shiba Inu (SHIB) is showing strong bullish signals as analysts highlight historical patterns, key resistance levels, and a surge in Futures Open Interest, pointing to a potential breakout toward $0.00004.
- Technical setups like the falling wedge breakout and rising market participation support the case for significant upside in early May.
Shiba Inu (SHIB) is once again capturing attention. Notably technical indicators have saparked bullish signs for the memecoin. This comes to play as technical analysts point to a potential bullish breakout in early May.
Notably one trader has come foward setting an ambitious short-term target of $0.00004. Despite mild volatility and a modest 1.4% intraday decline, SHIB remains up 6.1% over the past week, maintaining its recent upward momentum and sparking renewed interest among traders.
One of the most compelling outlooks comes from Trader Mike on TradingView, who has analyzed SHIB’s historical patterns to predict future price movements. Revisiting SHIB’s explosive rally between late September and October 2021—where the token skyrocketed from around $0.00000600 to $0.00008869.
Trader Mike noted the presence of large bullish candlesticks that signified strong buying interest. He contrasted this with the prolonged bearish phase from November 2021 to February 2024, characterized by weaker candles and wicks, which he believes may suggest market manipulation rather than organic selling.
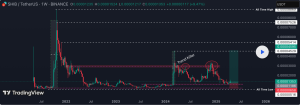
Crucially, despite that extended downtrend, Trader Mike observed consistent buyer activity, indicating a resilient underlying demand. His current analysis identifies $0.00003000 as a major resistance level—dubbed the “Trend Killer”—which SHIB has struggled to break cleanly in recent months. A successful breach of this level could pave the way for explosive gains.
Trader Mike revealed he entered a long SHIB position after a bullish daily candle close on April 9, 2025, around the $0.0000167 level. From there, he outlined several liquidity targets, including $0.00004529 (a 249% potential gain), followed by $0.00004595, $0.00005414, and even $0.00007526 and $0.00008869—levels reminiscent of SHIB’s 2021 peak.
Adding to the bullish case, another analyst known as Rose Premium Signals on X highlighted that SHIB recently broke out of a falling wedge pattern—a classic bullish reversal indicator. This breakout suggests an upward trend may be forming, with potential short-term targets at $0.00001510, $0.00001850, $0.00002110, and $0.00002460, all of which represent significant upside from current levels.
#SHIB$Shiba Inu has broken through the descending channel on the daily chart🔍
Current price action suggests targets at $0.00001510, $0.00001850, $0.00002110 and $0.00002460 which could double current price😉 pic.twitter.com/evPvWcjXlN
— Rose Premium Signals 🌹 (@VipRoseTr) April 28, 2025
Beyond technical patterns, market data also supports a bullish outlook. According to CoinGlass, SHIB’s Futures Open Interest has nearly doubled in April, climbing from under $97 million to almost $190 million by April 27. This surge suggests increased trader confidence, as capital flows into leveraged long positions—a typical precursor to sharp price movements.
With rising open interest, strong historical support, and emerging bullish technical patterns, Shiba Inu appears poised for a breakout. If momentum continues, a rally toward the $0.00004 mark could soon be more than just speculation—it could become reality.


