


Monero (XMR) is facing renewed downside pressure after a sharp intraday sell-off pushed price back toward the $438–$440 zone.
Despite a bullish long-term structure reflected in moving averages, short-term momentum has clearly weakened, placing focus on whether buyers can stabilize price or if further downside unfolds.
Current Price Context Shows Short-Term Stress
At the time of writing, XMR is trading around $438, down roughly 7% on the day. Volatility remains elevated at 5.60%, confirming aggressive participation during the move lower. Sentiment remains labeled bullish, but this contrasts with visible price behavior, suggesting sentiment may be lagging actual market conditions.
The 14-day RSI near 64.5 remains technically neutral, indicating the move lower has not yet reached oversold conditions. This leaves room for continuation before momentum becomes stretched.
Breakdown From Local Structure Triggered Acceleration
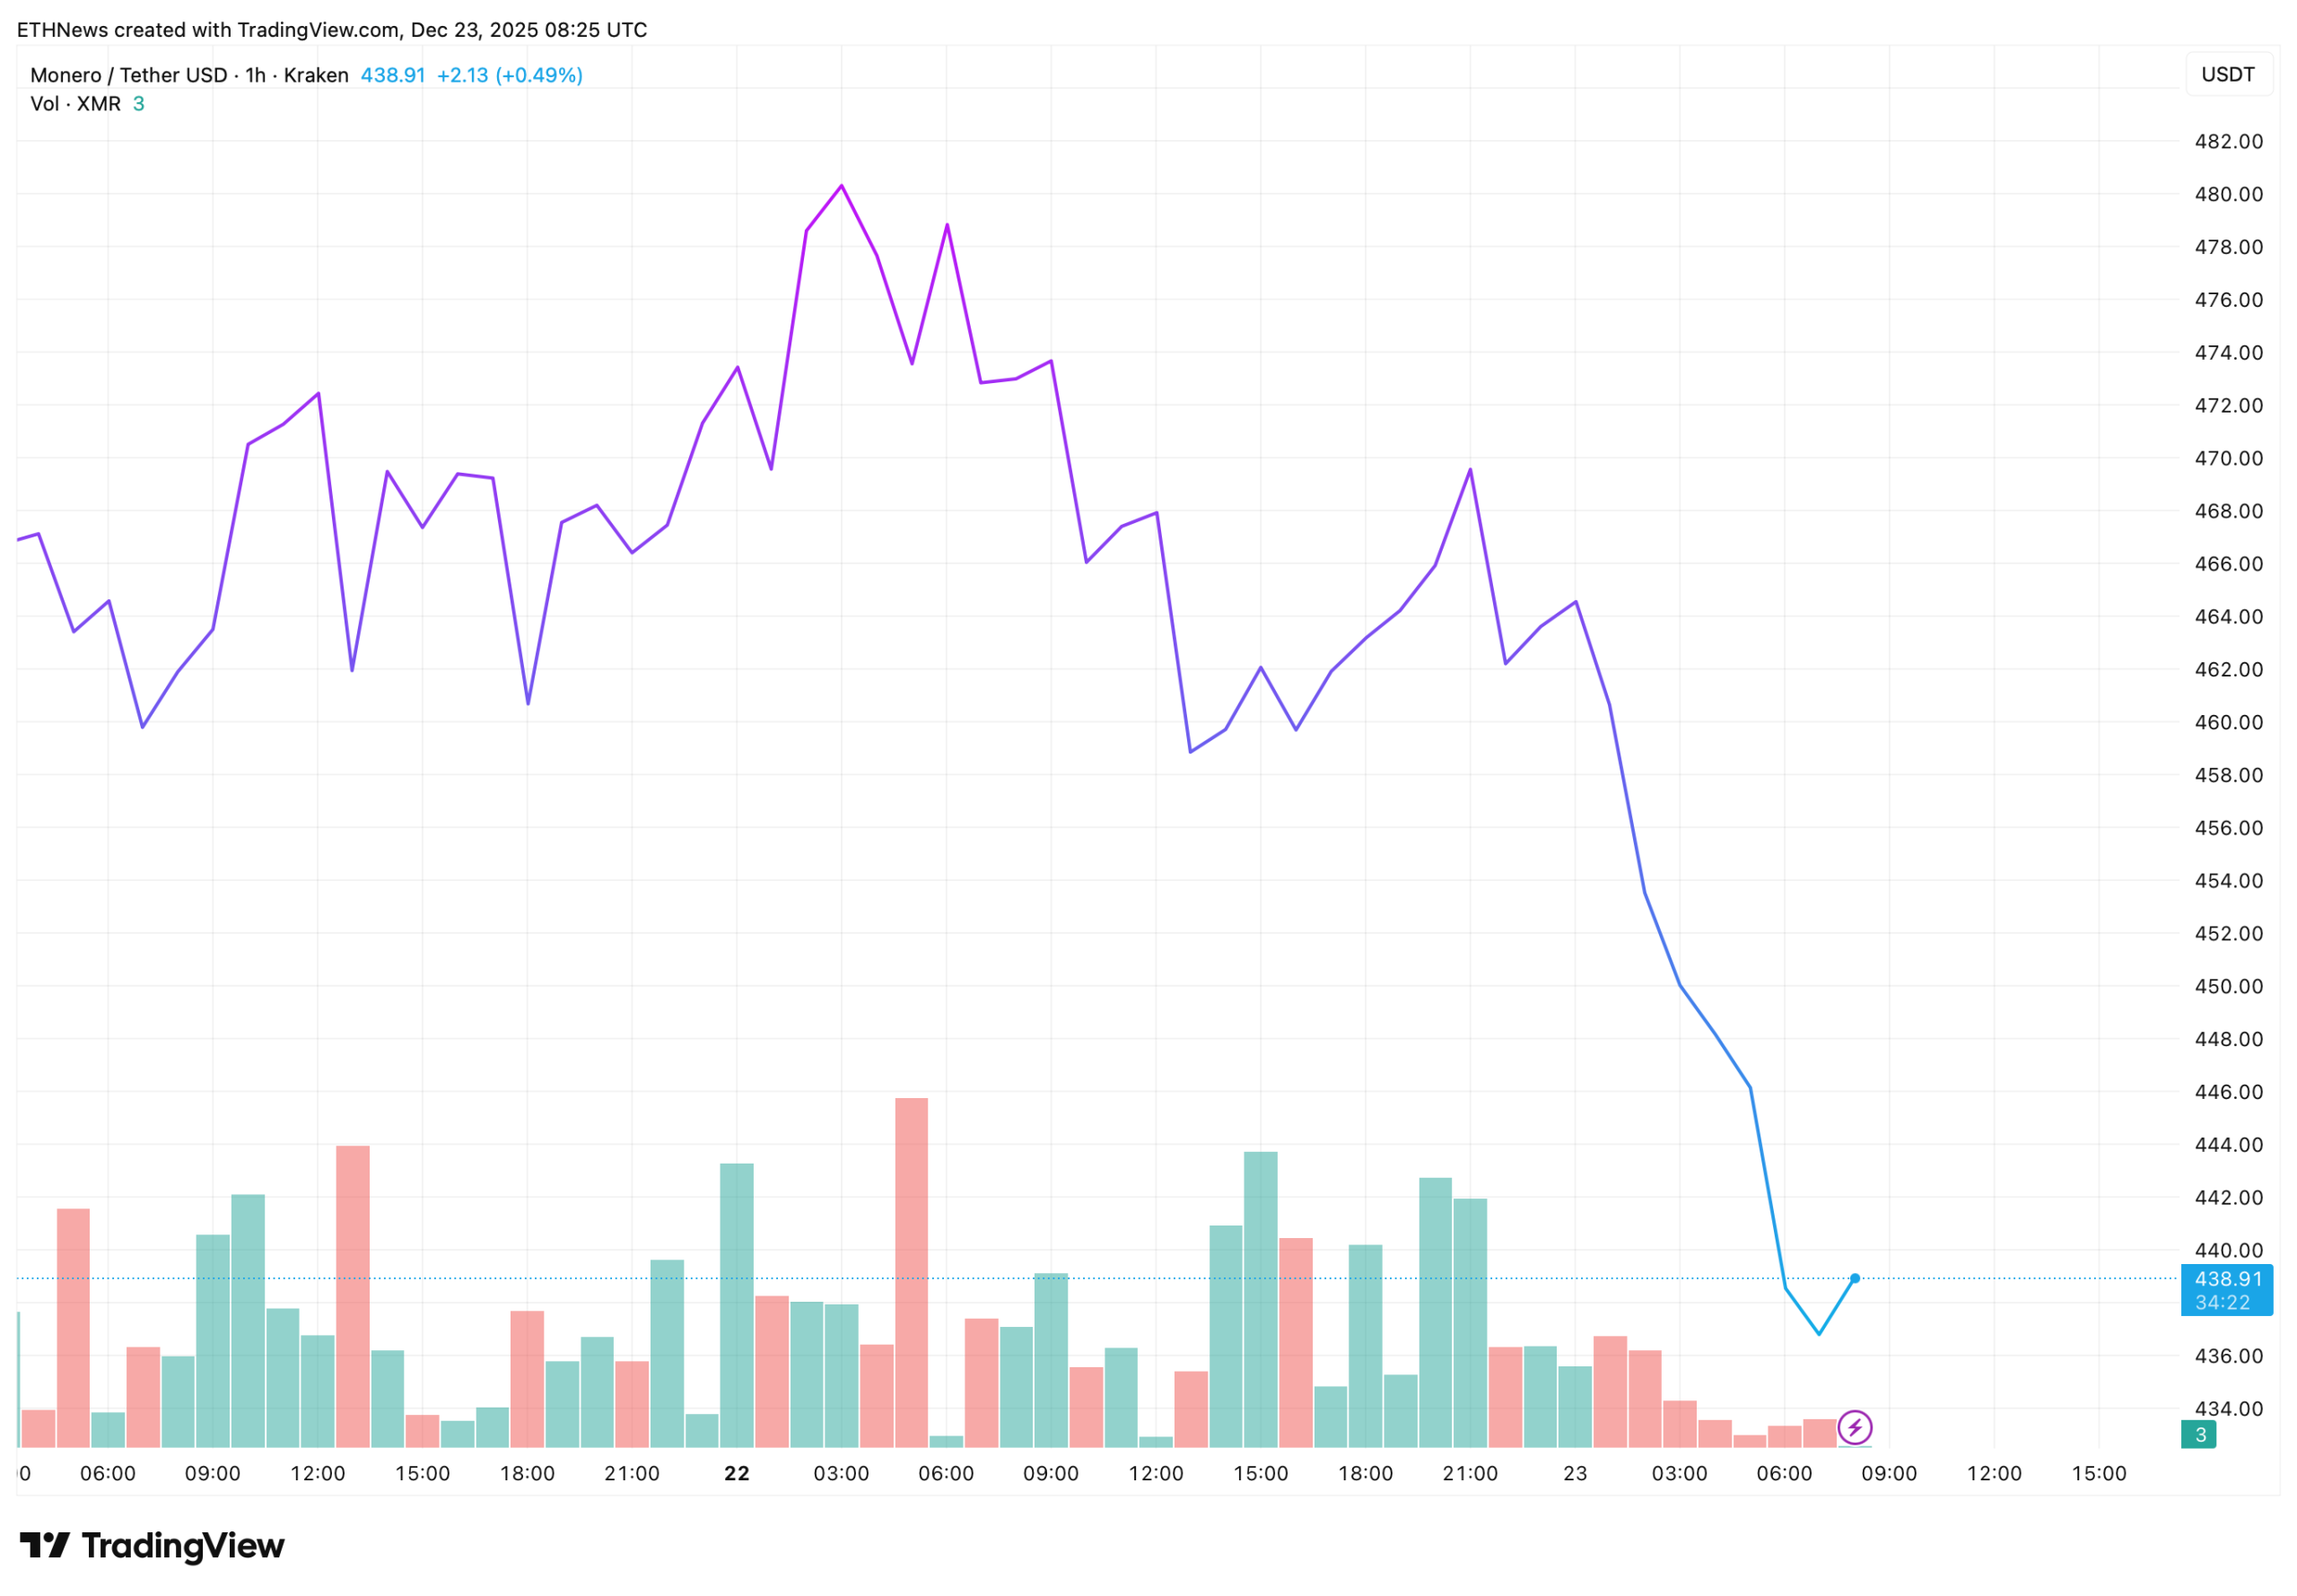
The 1-hour chart shows a clear loss of short-term structure. After multiple failed attempts to hold above the mid-$460s, price rolled over and accelerated sharply lower, producing a sequence of lower highs and expanding red candles.
The most notable feature is the steep cascade from the $455–$460 area, where prior rebounds consistently failed. Once that zone broke, downside momentum increased rapidly, with minimal buying response until price approached the $435–$440 range.
Volume behavior supports this view. Selling volume expanded during the drop, while the bounce into $438–$440 occurred on much lighter volume, suggesting relief rather than conviction buying.
Key Levels Now Define the Battlefield
The chart highlights several important zones going forward:
- Immediate support: $435–$440
This area has produced a small reaction bounce, but confirmation is still lacking. - Overhead resistance: $455–$460
This former support zone now acts as resistance and marks the level bulls must reclaim to restore short-term structure. - Broader trend reference:
The 50-day SMA at $398 and 200-day SMA near $299 remain well below current price, confirming that this move is a correction within a larger bullish framework rather than a structural breakdown, for now.
What the Price Action Suggests Next
If buyers fail to defend the $435–$440 zone, the lack of nearby structural support could allow price to drift lower toward the low-$420s without much friction. The absence of oversold RSI conditions increases that risk.
On the other hand, if XMR holds above current levels and begins forming higher lows on the hourly chart, a corrective rebound toward $455–$460 becomes possible. That level remains critical, without a reclaim, any bounce is likely to be sold into again.
For momentum to meaningfully shift, price would need to regain that resistance zone with expanding volume, something not yet visible on the chart.
Market Structure Favors Caution Short Term
Despite bullish longer-term indicators like moving averages and projected price metrics, the short-term structure is clearly bearish. Sharp downside moves, weak rebound volume, and repeated failures at prior support all suggest the market is still in a corrective phase.
Until XMR either reclaims $460 or shows clear basing behavior near current support, the risk remains skewed toward continued volatility rather than immediate trend resumption.


