


- Falling high-yield bond yields and a 2.2 MVRV Ratio indicate improving credit conditions and sustained Bitcoin investor confidence.
- Bitcoin’s price consolidates between $114,000 and $118,000, as liquidation clusters create a battleground for bulls and bears.
Bitcoin continues to track upward, drawing attention from traders who analyze macroeconomic signals and on-chain indicators for direction. As of mid-September, the leading cryptocurrency regained $116,000, mirroring the performance of the S&P 500. The price correlation between Bitcoin and equities shows both markets responding to the same macro drivers, such as credit conditions and investor risk appetite.
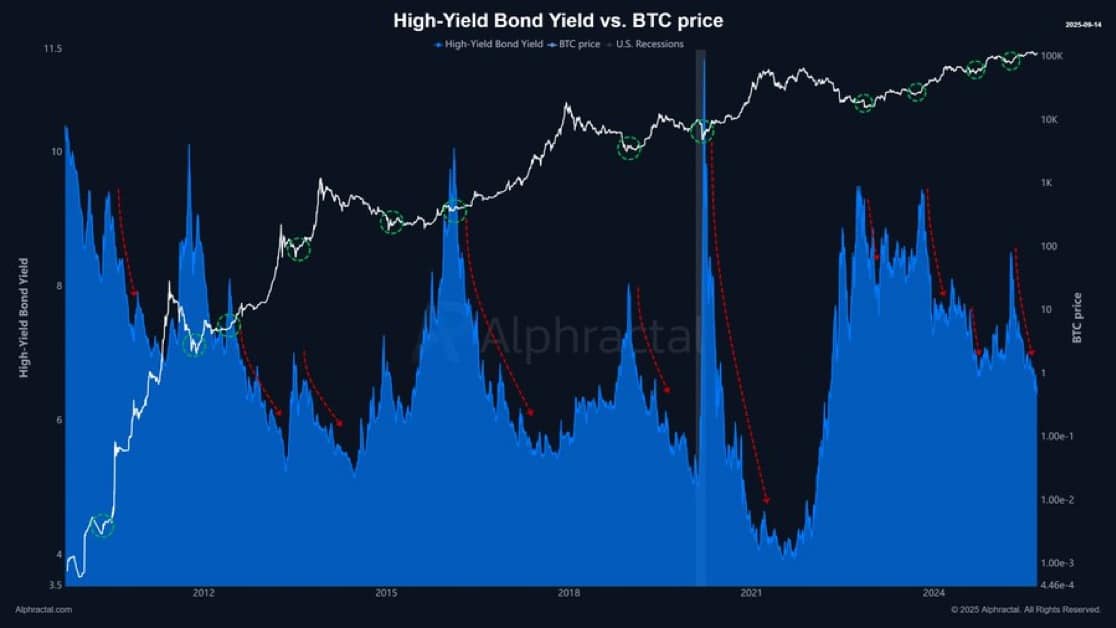
One major signal for Bitcoin’s current trend comes from the bond market. The ICE BofA US High Yield Index, a benchmark for riskier corporate bonds, shows that falling yields are supporting risk assets. Historically, declines in these yields indicate easing credit risk and renewed willingness among investors to seek higher returns outside of traditional safe havens.
This setup often directs more capital toward Bitcoin, especially as the asset’s returns compare favorably to alternatives. ETHNews analysts highlight that this bond-driven rotation has played out repeatedly across previous market cycles, and current patterns suggest the trend may continue.
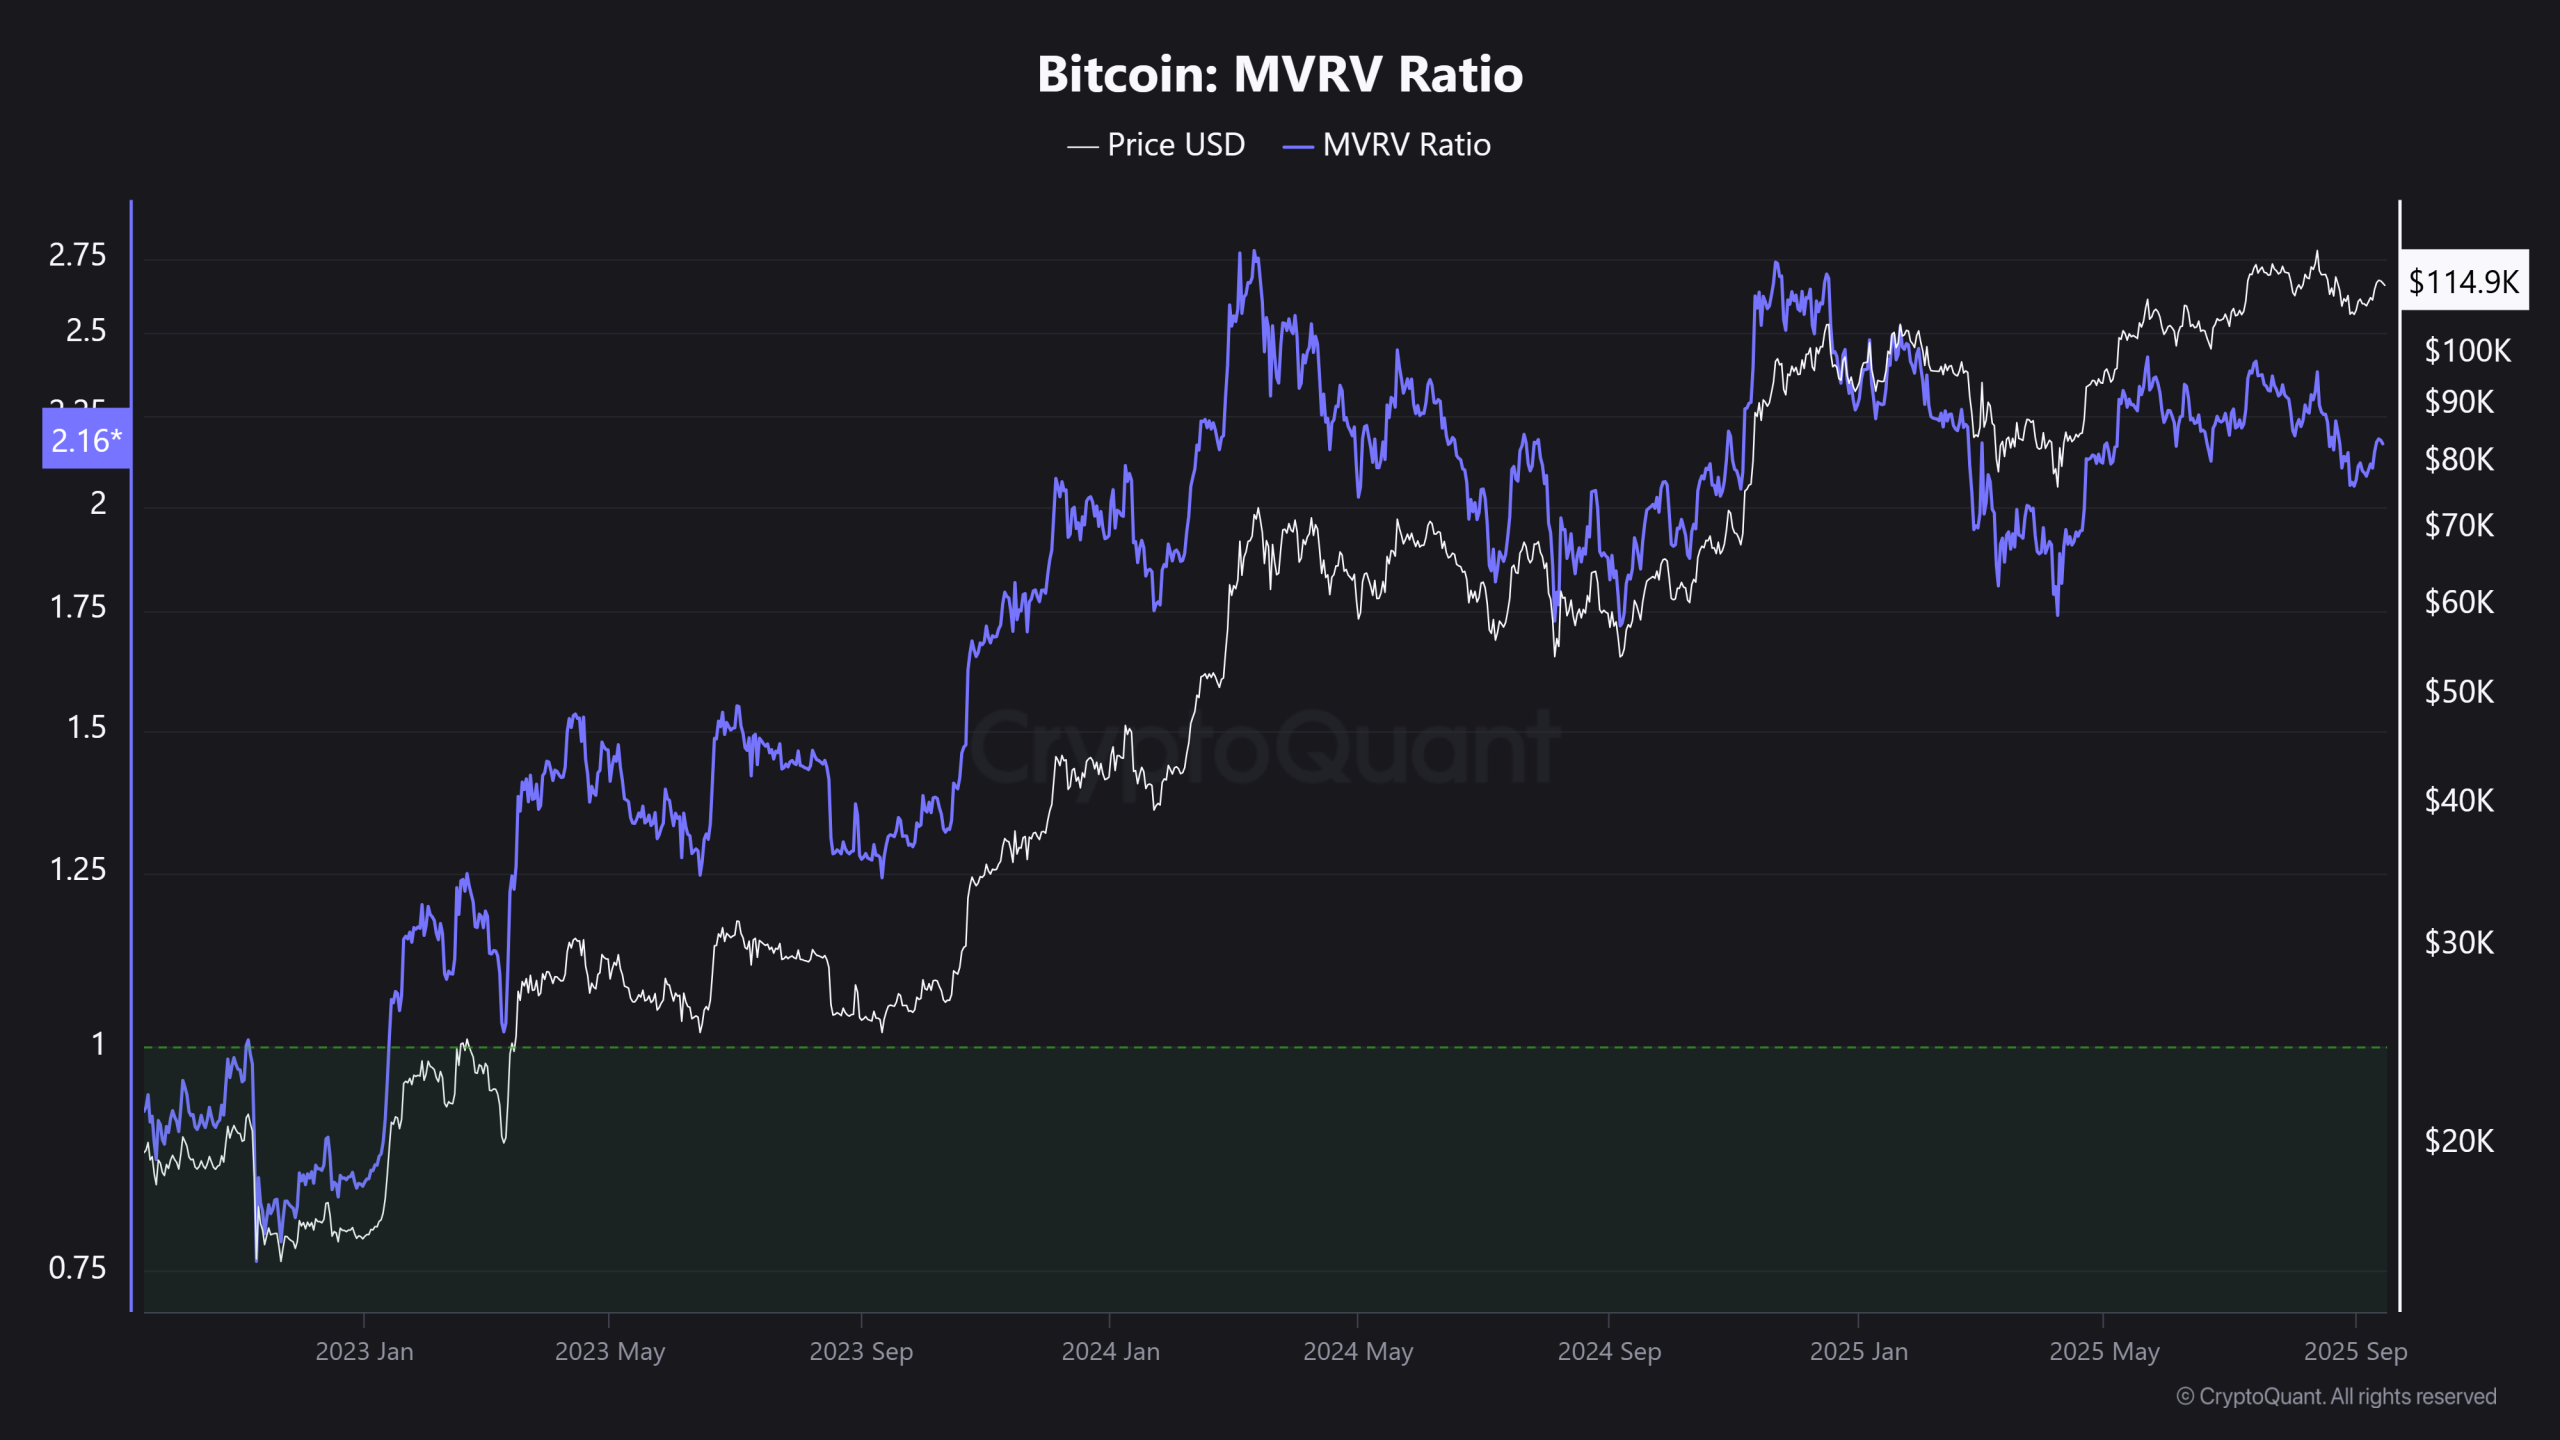
On-chain data further supports this position. The Market Value to Realized Value (MVRV) Ratio for Bitcoin stands at 2.2, according to CryptoQuant. This reading suggests the market is neither overheated nor at risk of a sharp correction.
Capital remains invested, supporting steady price action. Additionally, the Net Unrealized Profit and Loss (NUPL) metric sits at 0.523, reflecting moderate gains for investors and pointing to limited pressure for mass profit-taking.
Derivatives markets reinforce a cautiously bullish outlook. Open Interest in Bitcoin futures totals $83.62 billion, and a funding rate of 0.0091% indicates healthy, yet controlled, long interest.
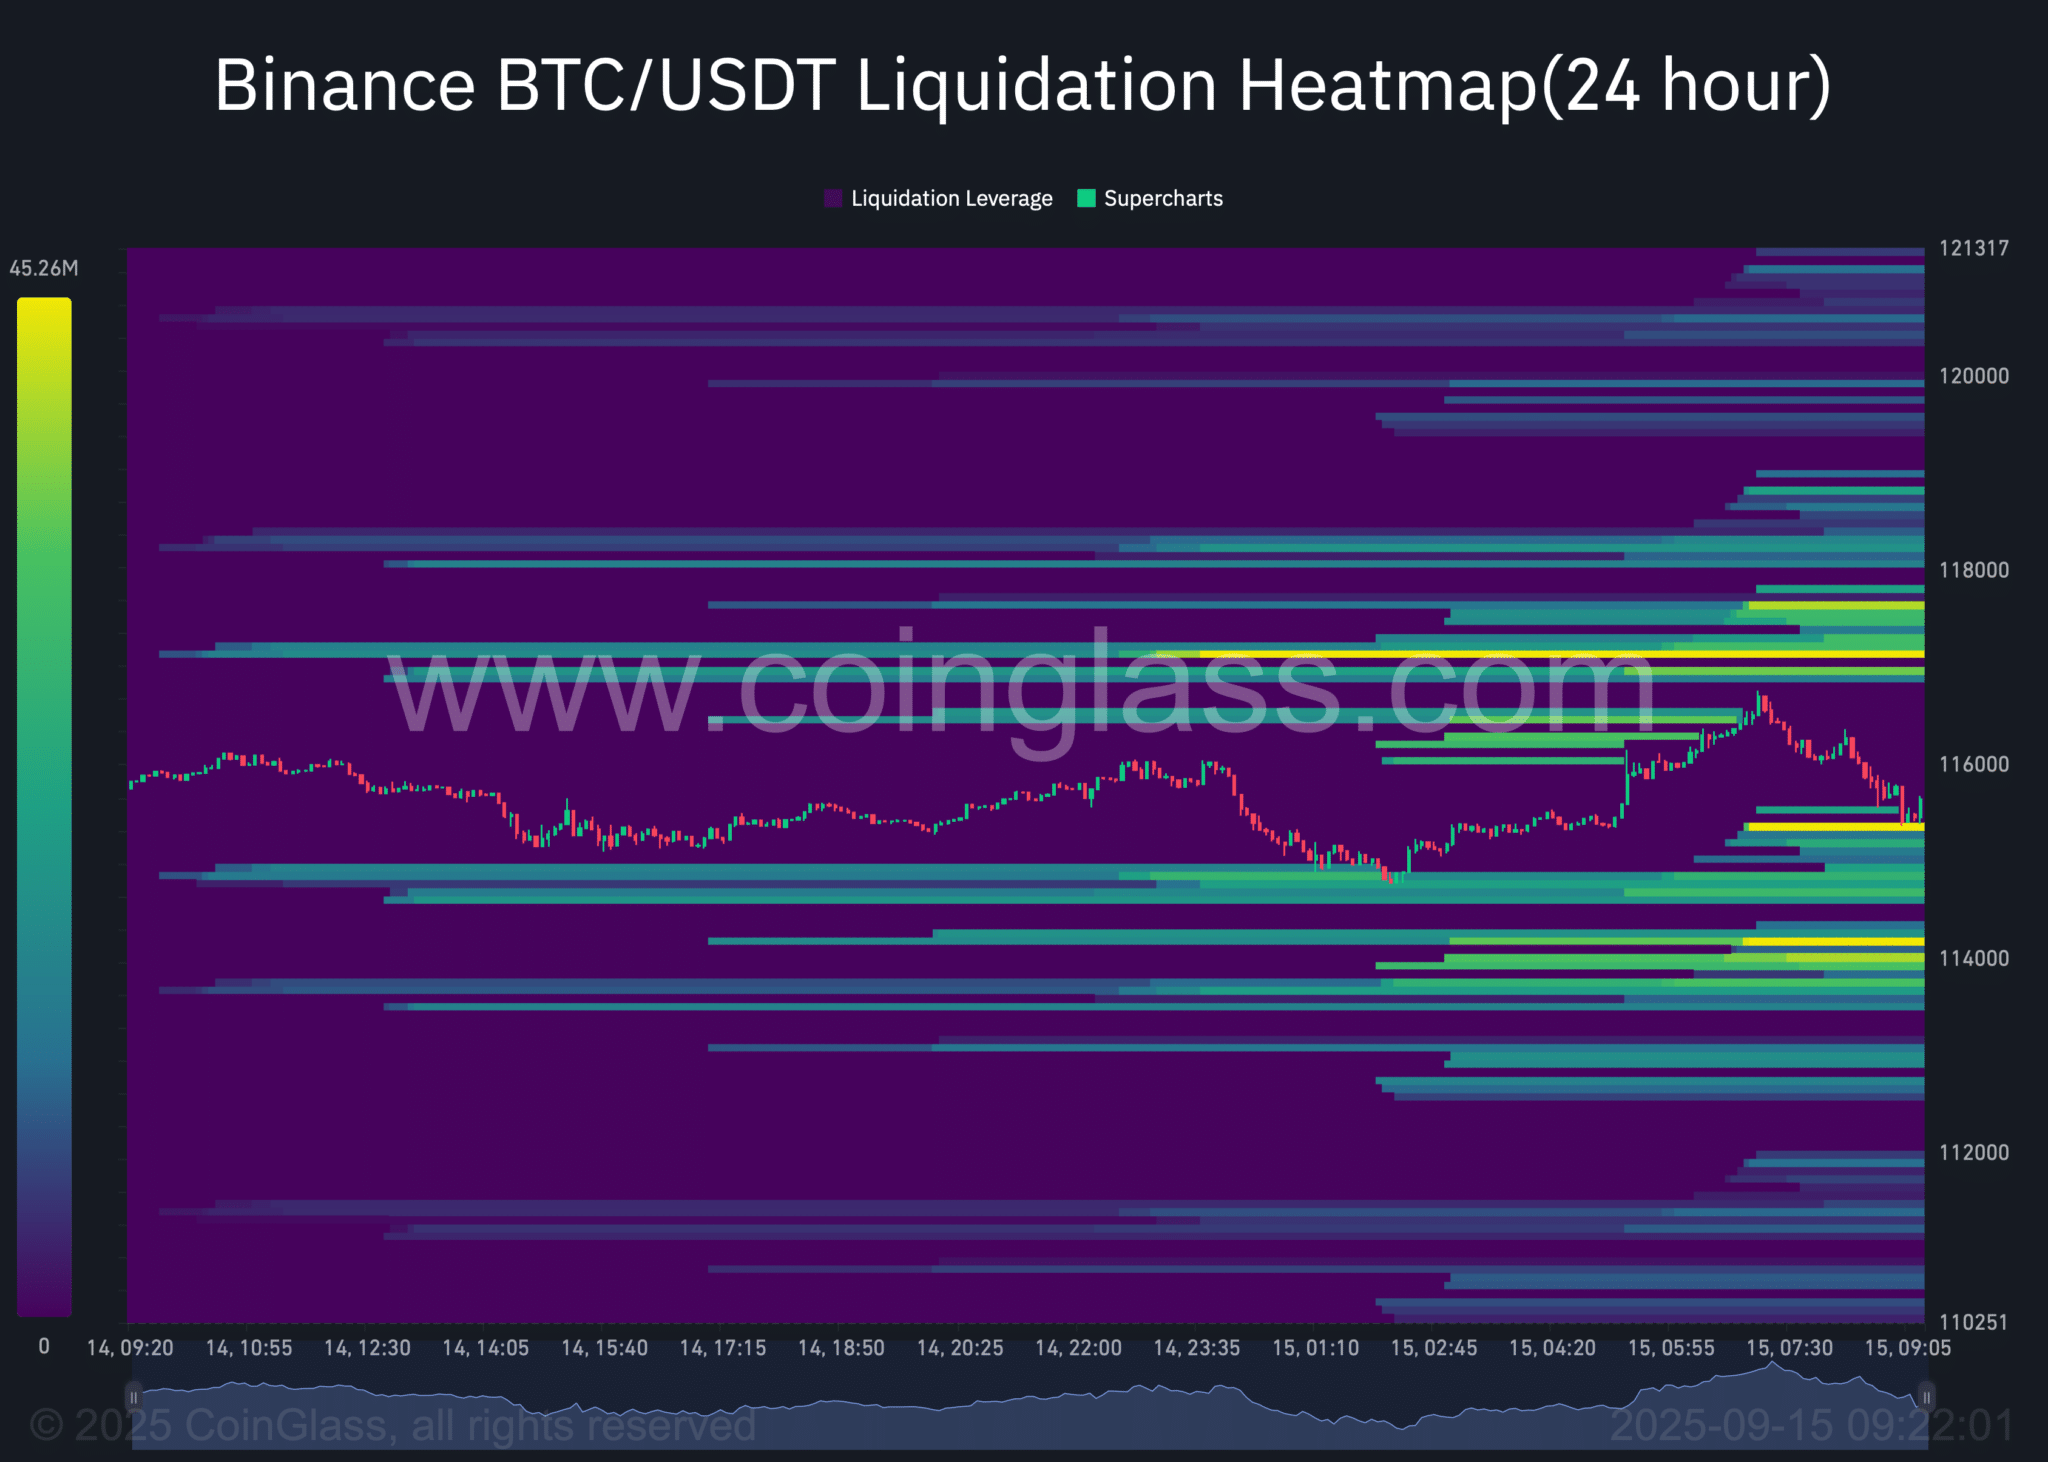
CoinGlass data spotlights concentrated liquidation zones between $114,000 and $118,000, which could serve as both resistance and support. If positive momentum holds, traders are watching for a possible move toward $118,000—a level that, if reached, could mark the start of a new phase in Bitcoin’s price cycle.
Bitcoin is currently consolidating around $114,873, slightly down 0.41% today. Despite the dip, it’s still holding above the key $115K level, and the market remains cautiously bullish.
One of the most notable developments is that the 30-day Miner-to-Exchange Flow average has dropped to a low, signaling that miners are accumulating BTC rather than selling — a historically bullish indicator.
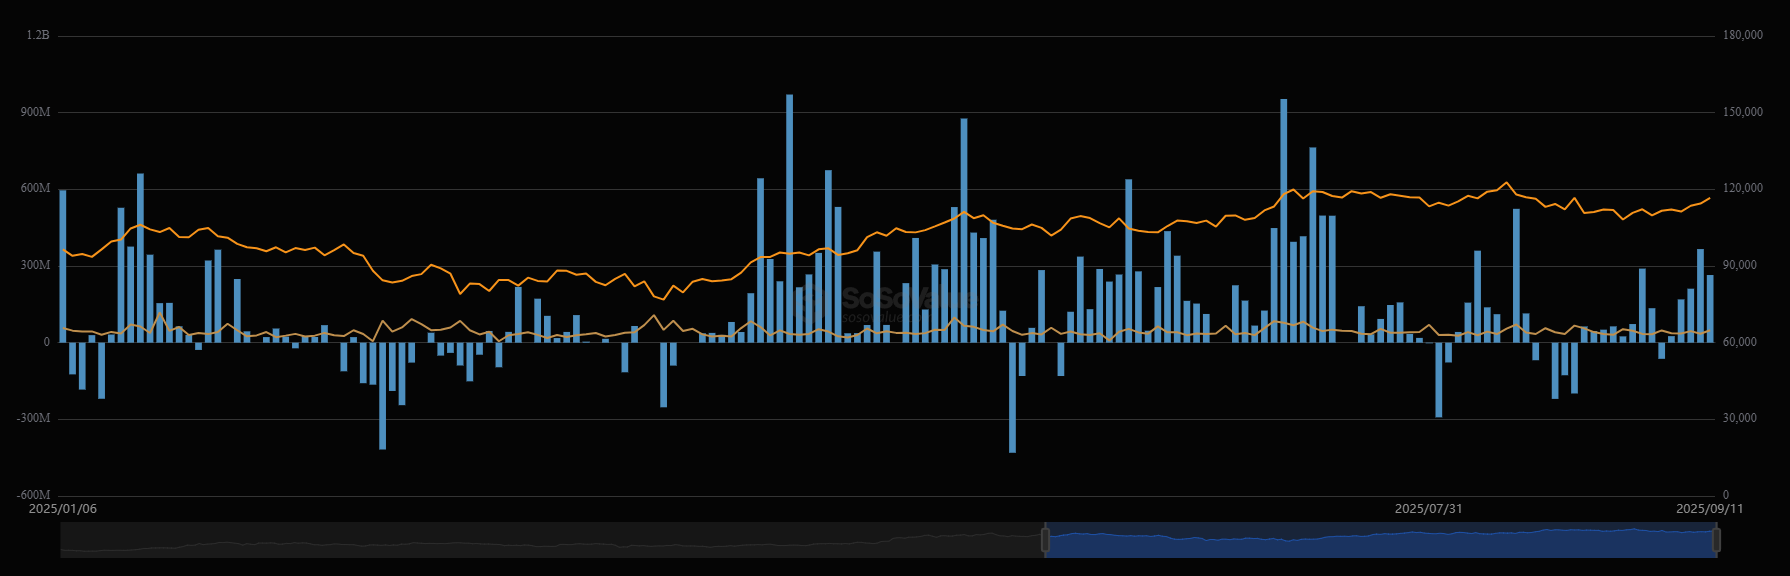
Institutional flows continue to dominate the narrative. Bitcoin funds saw $2.4 billion in inflows last week, led by U.S. spot ETFs such as BlackRock’s IBIT, which alone attracted $2.3 billion.
This flood of capital into ETFs is reinforcing the thesis of a continued supply squeeze, especially as Bitcoin’s circulating supply edges closer to its 21 million cap.
Macroeconomic sentiment is also a driving force behind current price action. There is a 97% market probability of a 25 basis-point rate cut by the Federal Reserve at its next policy meeting on September 17, fueling risk-on appetite across crypto markets. ETHNews analysts expect that a confirmed rate cut could act as a tailwind for Bitcoin, potentially sending it to retest the $120K resistance zone.
Meanwhile, Michael Saylor’s Strategy-like strategy continues — his firm reportedly acquired 525 BTC for $60.2M, bringing total holdings to over 638,985 BTC. This continues the trend of aggressive institutional accumulation, especially from legacy players.
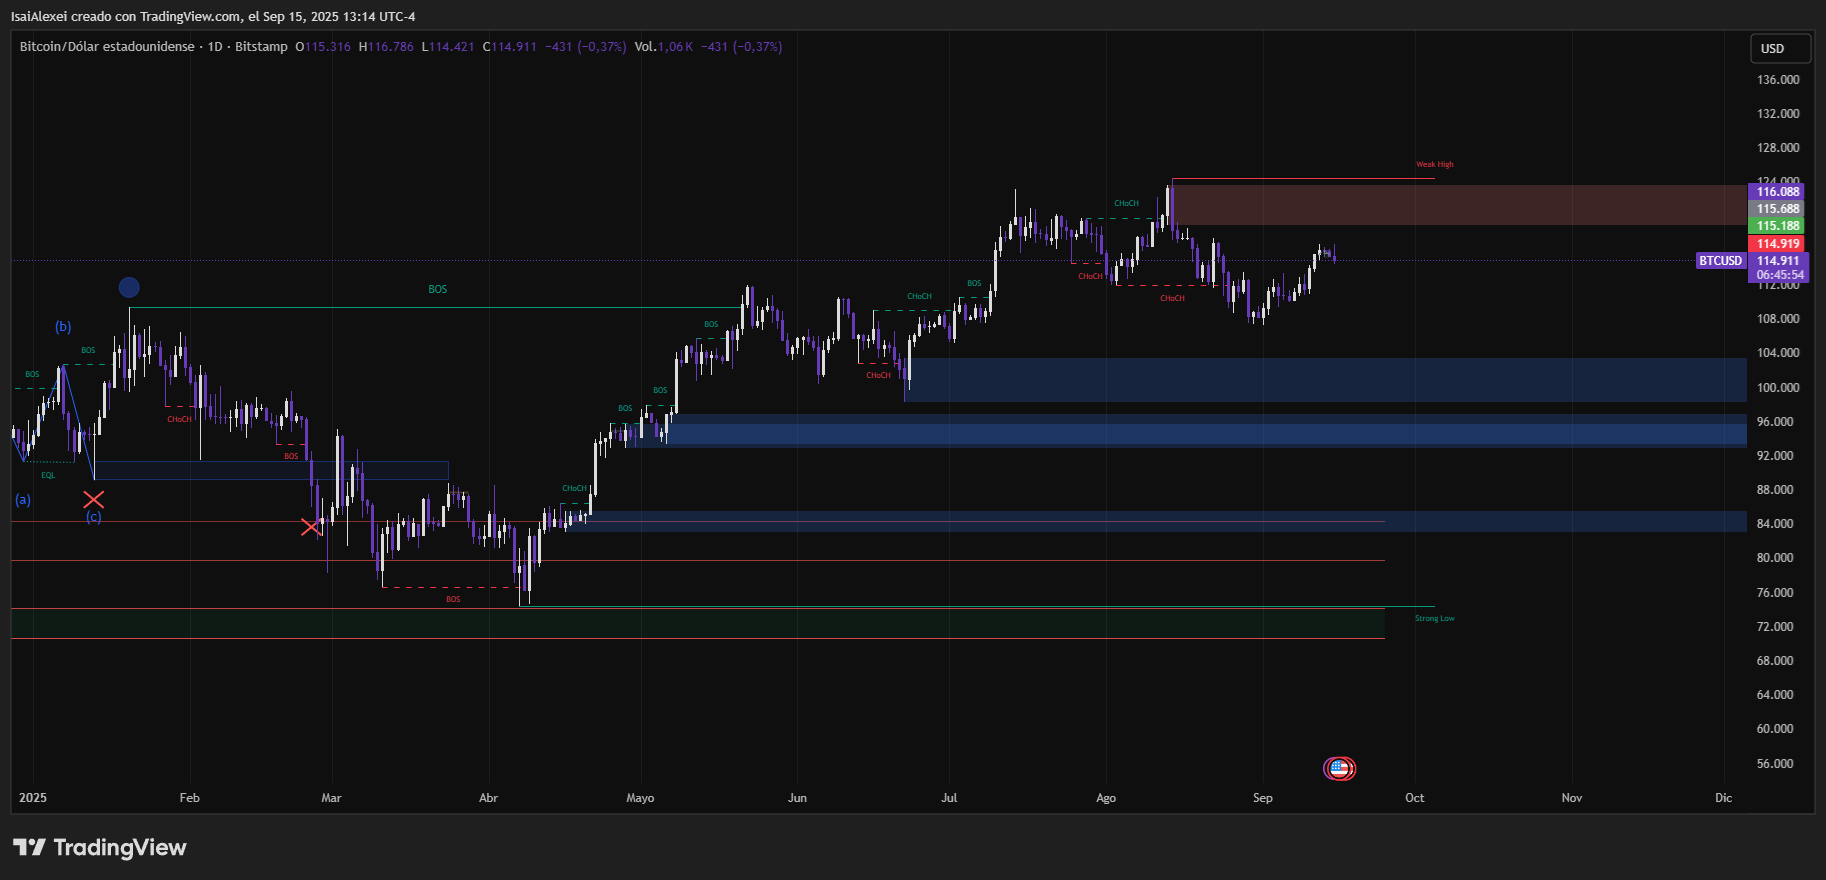
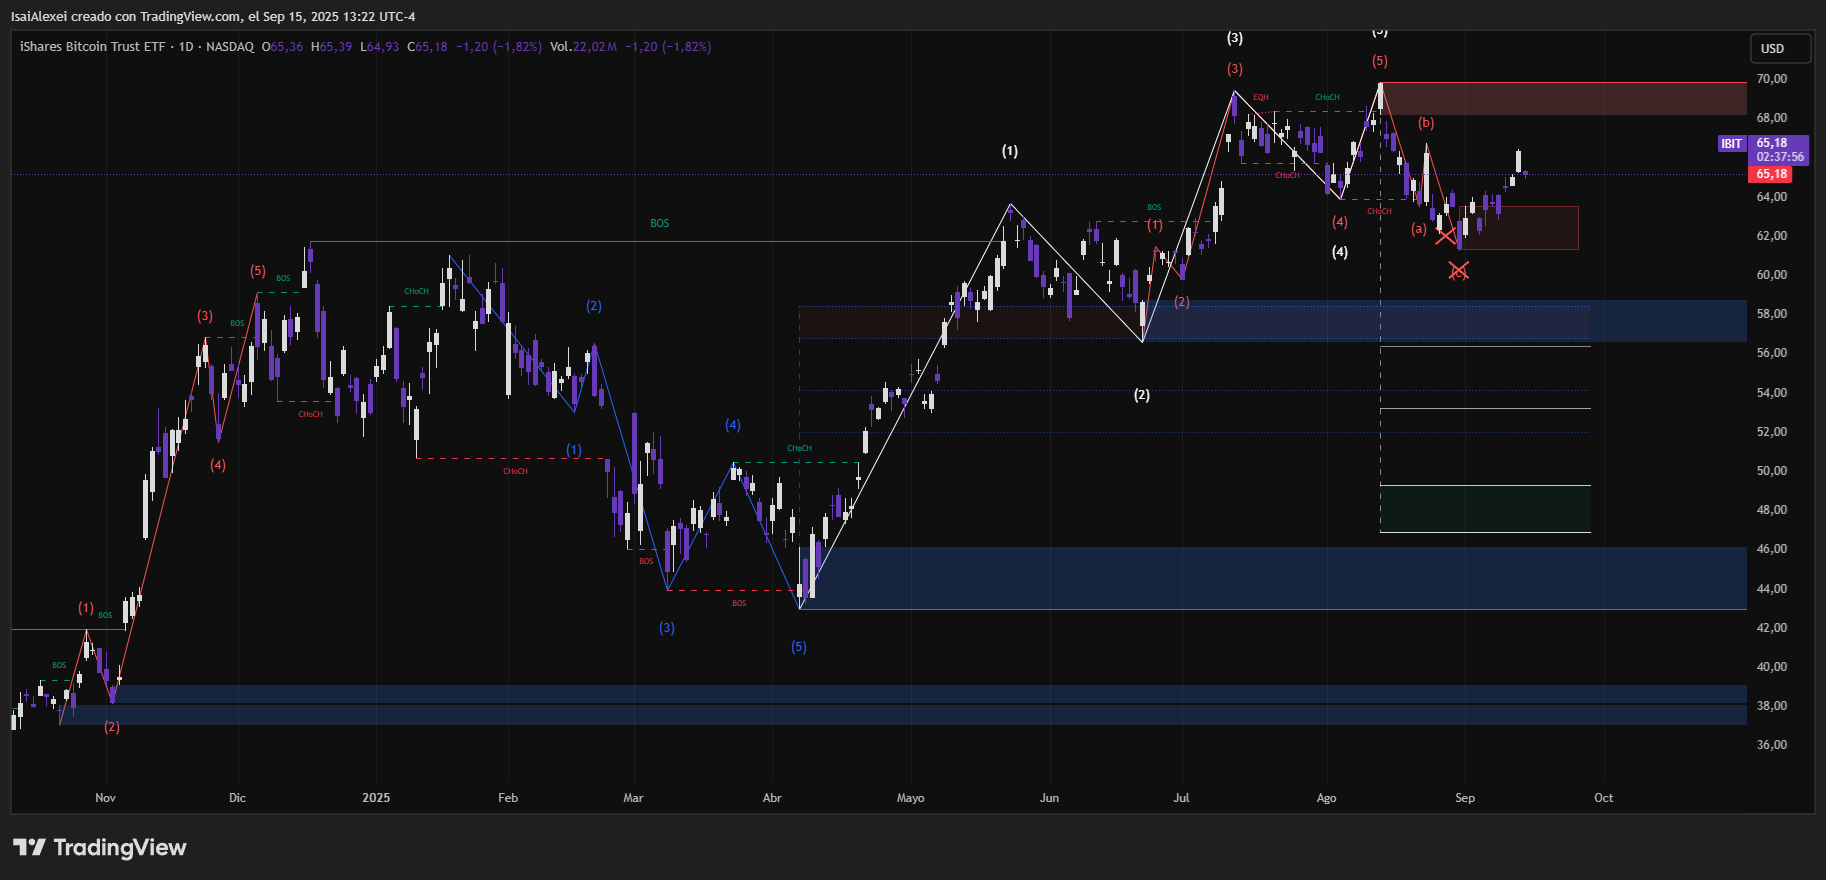
On the technical side, several analysts are tracking an ascending triangle pattern, which typically signals bullish continuation. If BTC breaks above $116,900, it could target $119,000–$121,000. However, a failure to hold $113K may invite short-term bearish momentum down to $108,000 before further accumulation.


