


Hyperliquid’s HYPE token is showing signs of sustained weakness after failing to hold recent recovery highs, with price action now compressing near short-term support as volatility remains elevated.
Price Action Breakdown: Where Momentum Broke
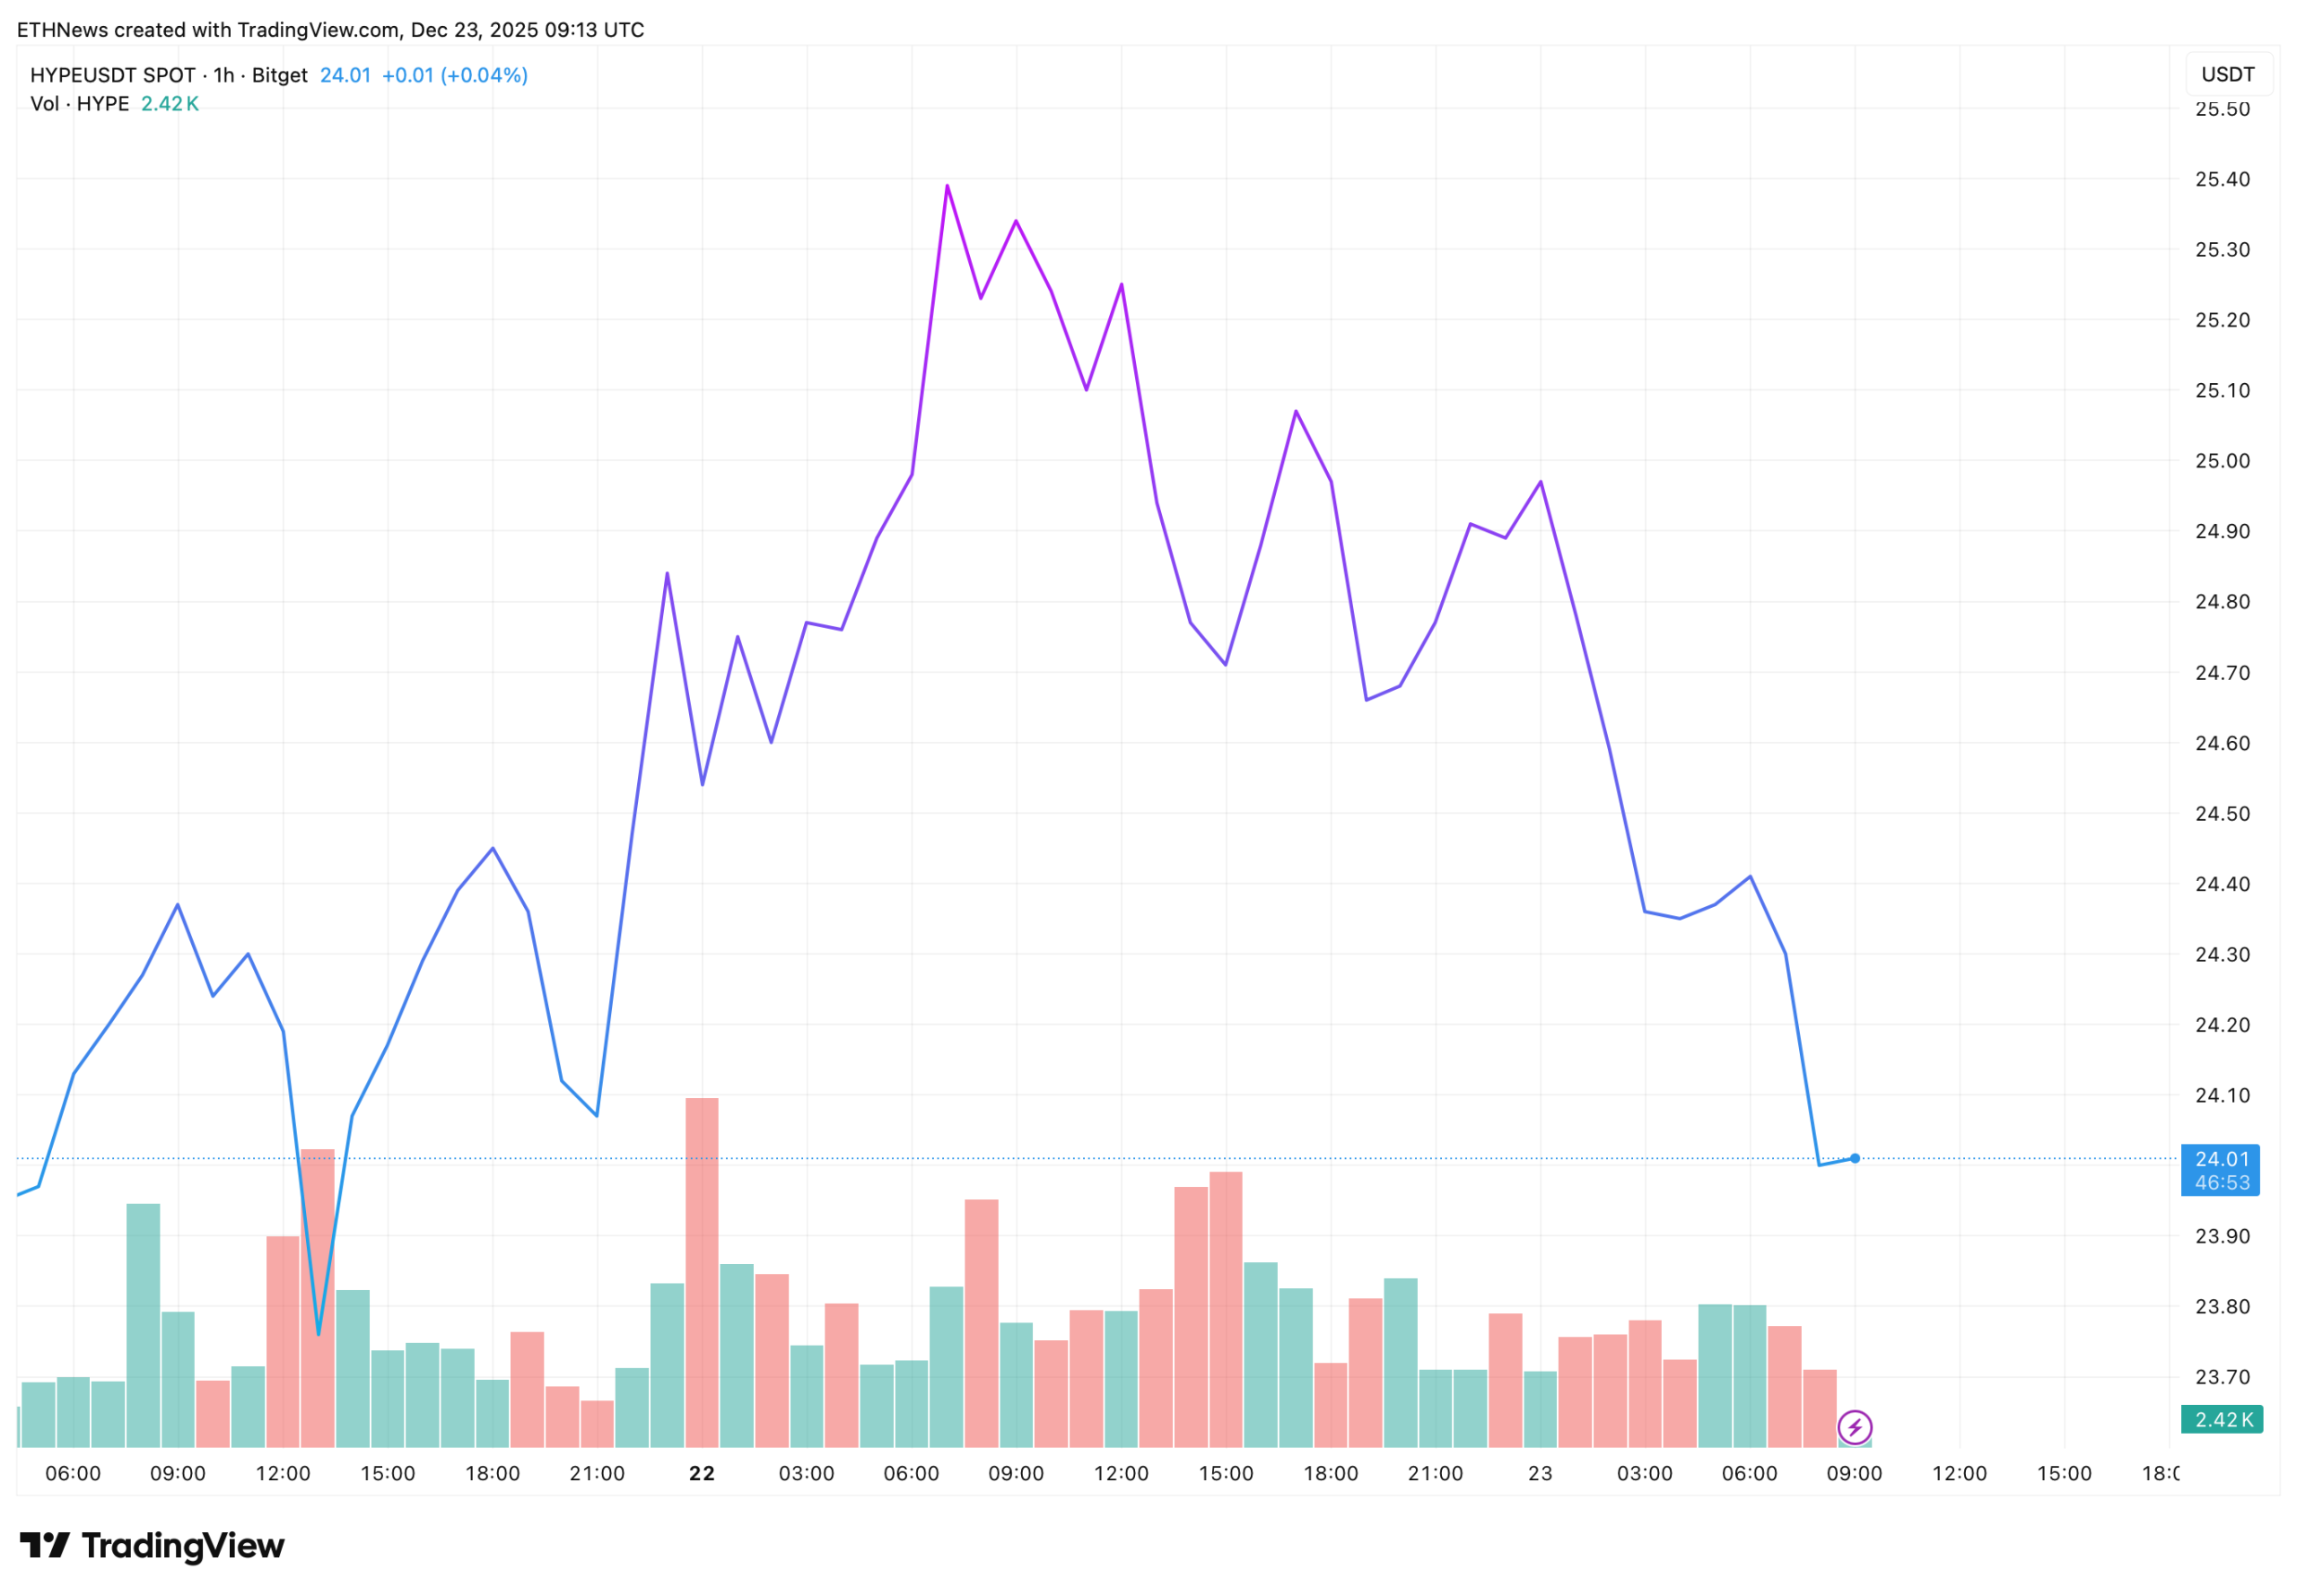
The TradingView chart shows HYPE trading around $24.00, following a steady decline from the recent local peak near $25.4–$25.5. That rejection marked a clear failure at resistance, triggering a sequence of lower highs and lower lows on the intraday timeframe.
After the initial sell-off, price attempted a modest bounce, but that recovery stalled quickly. Each rebound was met with renewed selling, confirming that buyers lacked the strength to reclaim prior levels. The sharp drop into the $24.30–$24.40 zone briefly slowed downside momentum, but follow-through buying remained limited.
Volume data reinforces this picture. Selling spikes accompanied the strongest downward moves, while bounce attempts occurred on comparatively weaker volume. This imbalance suggests distribution rather than accumulation during the recent range.
Key Technical Levels to Watch
From the chart structure, $24 is now acting as immediate support. The latest candles show price hovering just above this level, indicating hesitation rather than a decisive rebound.
If this support fails, the absence of nearby structural demand could open the door for a deeper move toward lower psychological levels, aligning with the broader bearish bias reflected in the metrics panel.
On the upside, former support near $24.80–$25.00 has flipped into resistance. A sustained move back above that zone would be required to neutralize the current bearish structure and suggest that sellers are losing control.
Indicators Point to Fragile Conditions
The metrics snapshot adds further context to the chart behavior. HYPE is trading well below both its 50-day SMA at $33.78 and 200-day SMA at $34.47, highlighting how extended the broader downtrend has become.
Volatility stands at 11.70%, classified as very high, which explains the sharp intraday swings and unstable price behavior. Meanwhile, the 14-day RSI at 37.93 sits in neutral territory but leans toward oversold conditions, suggesting downside momentum is slowing, though not yet reversing.
Sentiment remains bearish, reinforced by an Extreme Fear reading on the Fear & Greed Index. Historically, such conditions can precede short-term relief rallies, but they do not guarantee a trend reversal without structural confirmation on price.
What Comes Next for HYPE?
In the near term, the market’s focus is firmly on whether $24.00 can hold. A clean break below this level would likely accelerate selling pressure, especially given the lack of strong support visible on the immediate chart.
Conversely, if buyers manage to defend this zone and push price back above $24.80, HYPE could attempt to stabilize and form a short-term base. That scenario would still represent a corrective bounce rather than a full trend shift unless higher resistance zones are reclaimed.
For now, the price movement suggests caution. Price remains compressed, volatility is elevated, and the broader structure favors sellers until proven otherwise.


