


Technical chart shared by analyst GainMuse shows HYPE emerging from a long corrective phase following its peak earlier in the year.
Price action has respected a descending structure for months, capped by a clear resistance trendline while forming successive lower highs.
Recently, however, HYPE has begun holding above a rising support line, marking a subtle but important change in behavior. Instead of accelerating lower, price is consolidating with higher reaction lows, suggesting selling pressure is weakening.
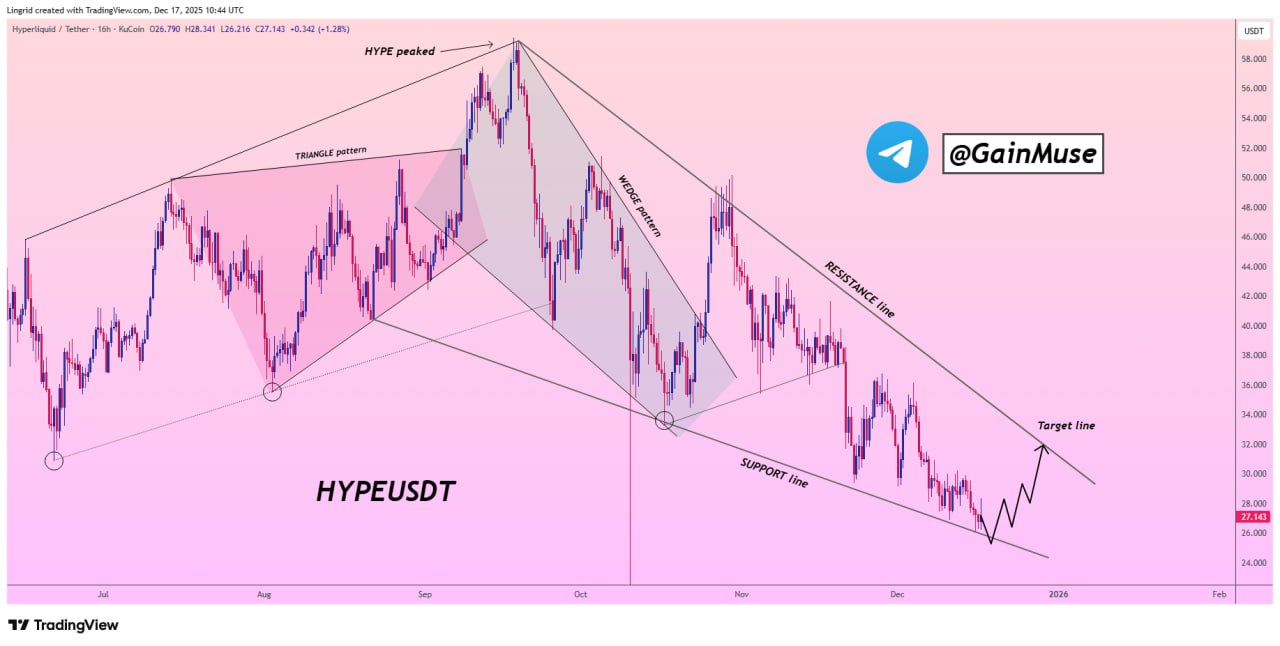
The chart also highlights a potential pathway toward the descending resistance, indicating that momentum is compressing rather than breaking down further.
This setup reflects a market transitioning from aggressive distribution into stabilization, where structure compression often precedes directional expansion.
TradingView Data Confirms Base Formation Near $27
The 4-hour TradingView chart reinforces this stabilization narrative. After a steep decline from above $35, HYPE found demand near the mid-$26 area, followed by a shallow rebound and sideways consolidation.
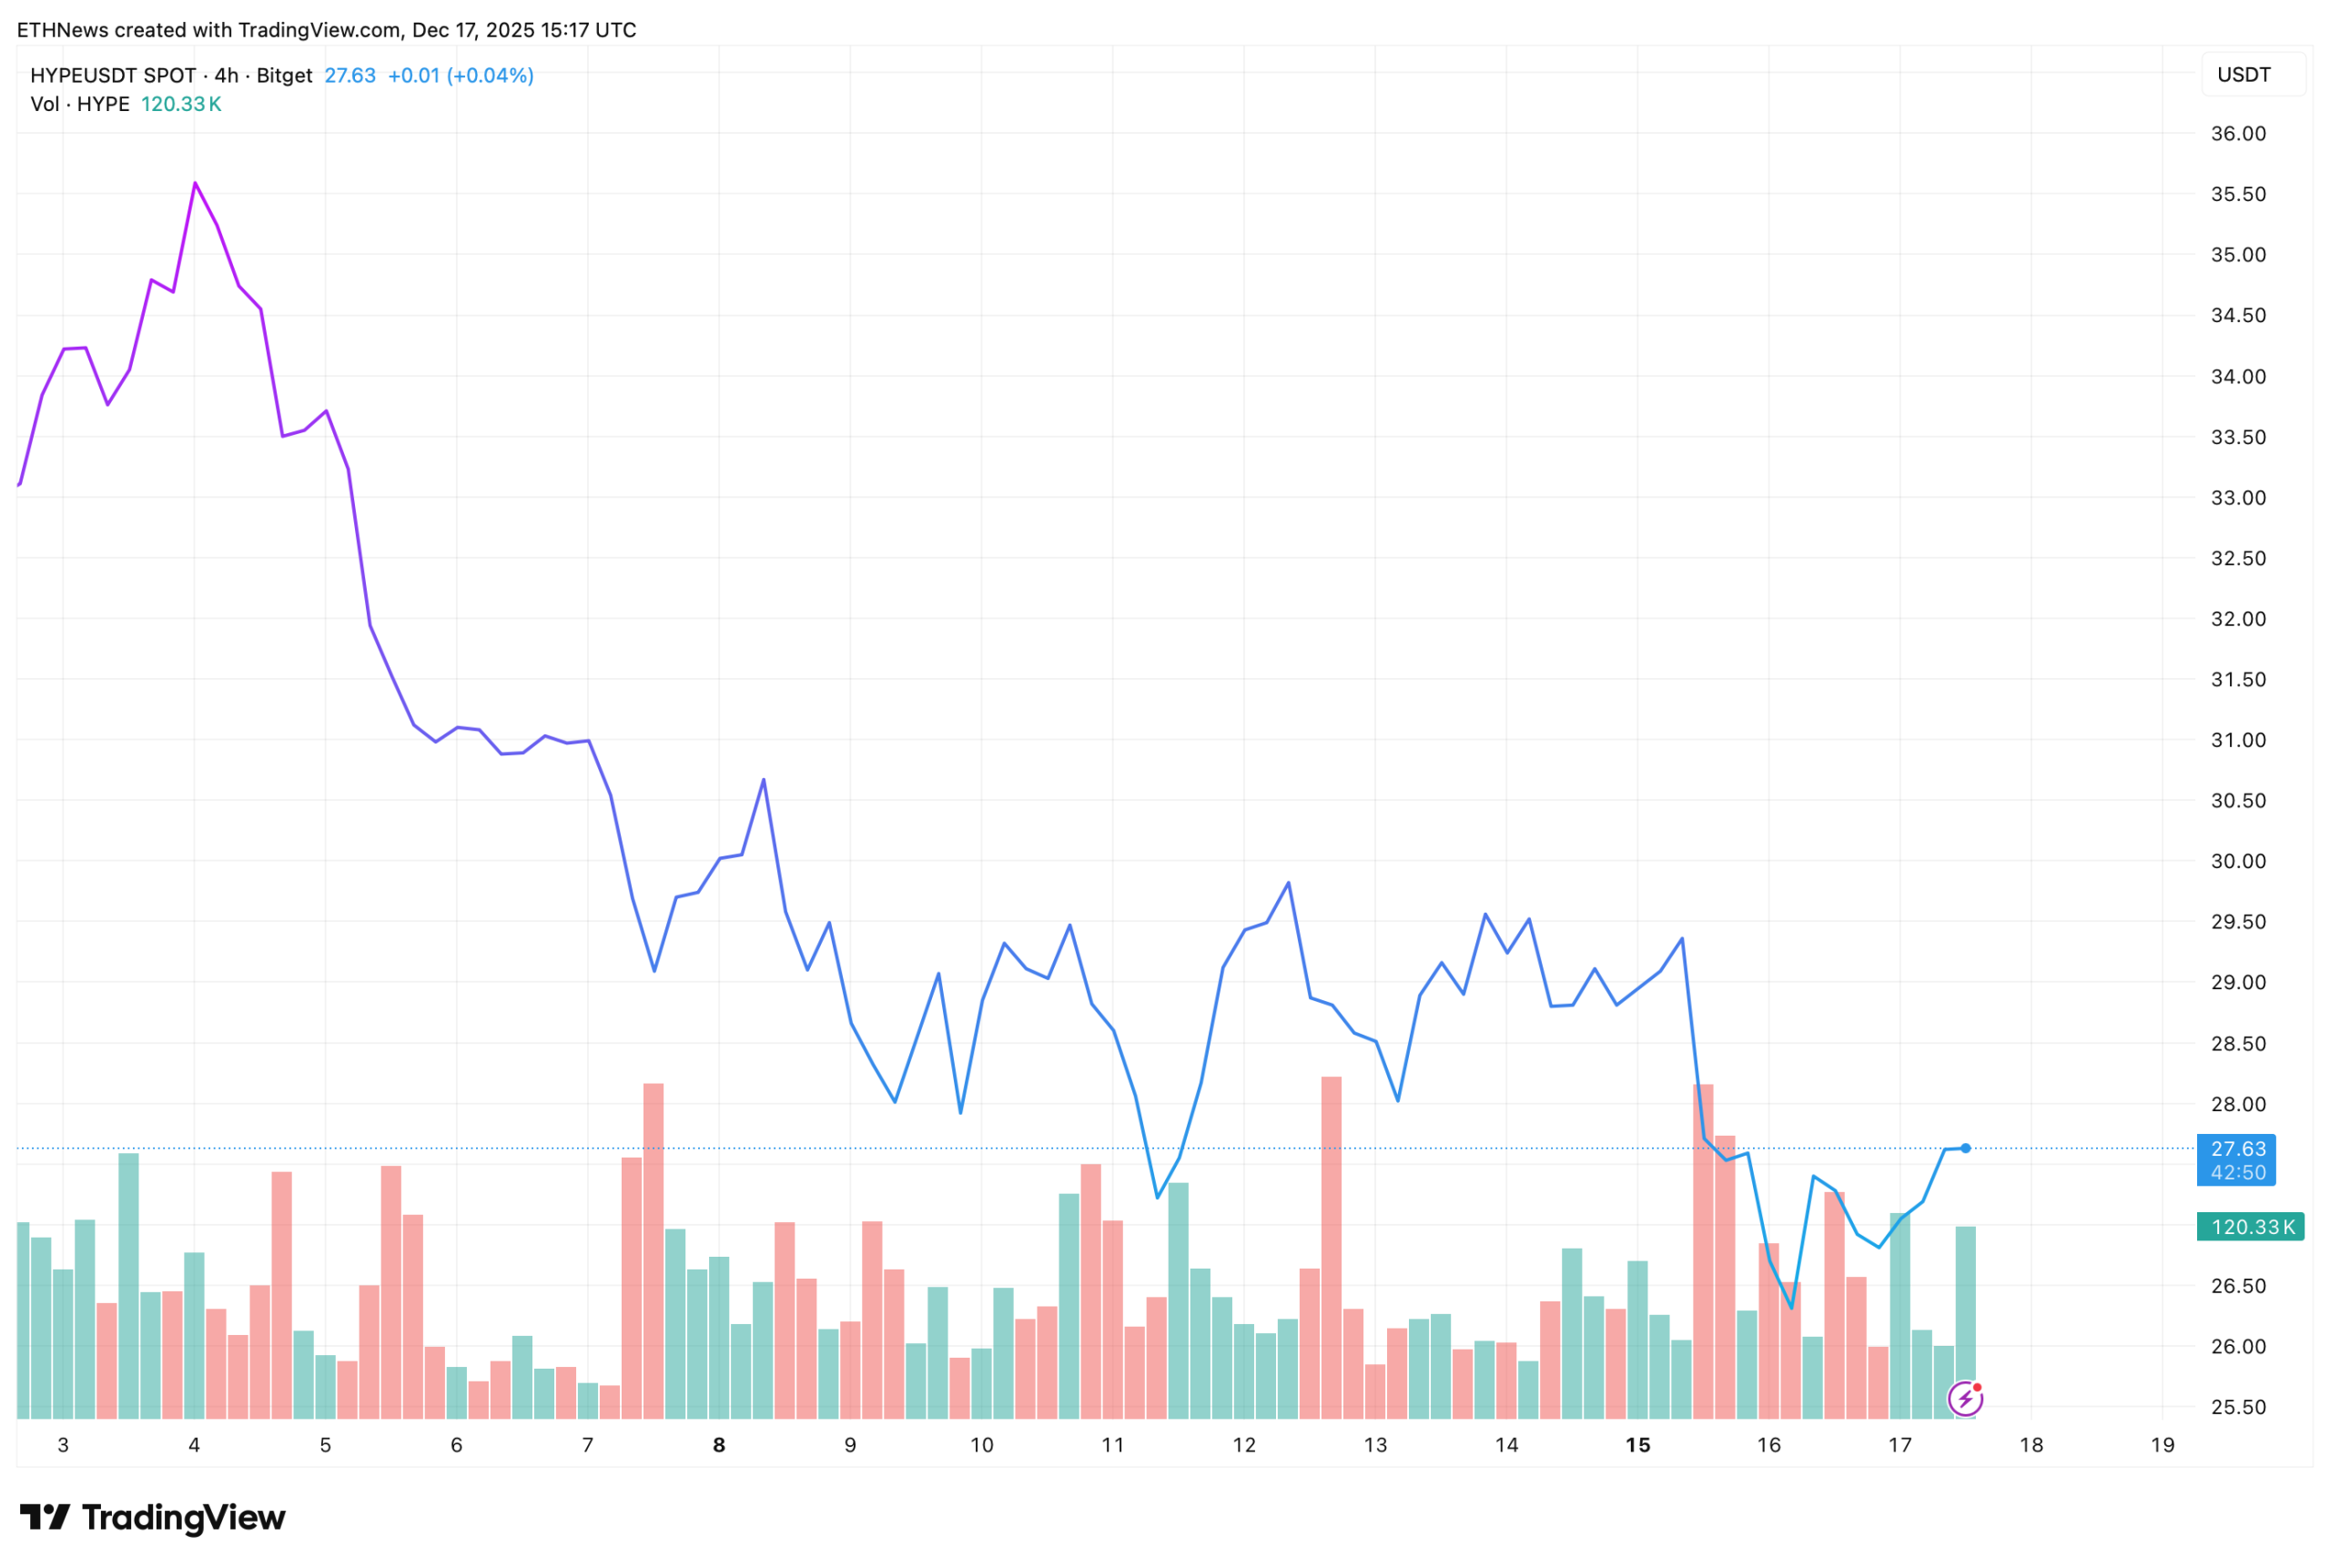
Current price is hovering around $27.63, with volume contracting compared to earlier selloffs. This drop in volume aligns with the idea that forced selling has largely played out. Instead of sharp continuation moves lower, price action now shows controlled fluctuations within a narrowing range.
Such behavior typically reflects indecision rather than panic, with market participants waiting for confirmation before committing to a new trend.
Momentum and Volatility Metrics Highlight Mixed Conditions
Indicator data paints a balanced but cautious picture. The 14-day RSI sits at 33.89, signaling recovery from oversold conditions without entering bullish territory. This suggests downside momentum has cooled, but upside strength has not yet fully returned.
Volatility remains elevated at 10.48%, reinforcing that HYPE is still in a high-risk environment despite recent stabilization. Meanwhile, price continues to trade well below both the 50-day SMA at $36.13 and the 200-day SMA at $35.04, confirming that the broader trend remains bearish.
Sentiment indicators also remain strained. The Fear & Greed Index at 16 reflects extreme fear, while only 12 of the last 30 days have closed green. These conditions often coincide with late-stage corrections rather than early bull phases.
Market Outlook Depends on Support Holding
For now, HYPE’s structure hinges on maintaining support above the rising trendline highlighted in the GainMuse chart. Continued defense of this zone would keep the recovery scenario intact and allow price to gradually challenge descending resistance.
However, failure to hold this base would likely reopen downside risk, especially given the distance from key moving averages. Momentum expansion — not price alone — will be required to confirm a broader trend shift.
At this stage, HYPE appears to be transitioning from correction to consolidation, with the next directional move still unresolved.


