


SUI is attempting to recover after one of the sharpest weekly drops of the year, now trading around $1.52 as traders assess whether momentum is shifting or simply pausing.
The reclaim of the $1.45 level marks the first meaningful sign of stabilization. Analyst DaanCrypto emphasized how essential this zone is, noting that SUI “did its job” by regaining it, a necessary step before any real recovery attempt.
The $1.60 Resistance Will Decide Whether a Relief Rally Can Start
The next challenge lies just ahead. DaanCrypto’s chart highlights the $1.60 area as the decisive barrier that must break to ignite a larger relief bounce. If bulls push SUI above this zone, the chart shows a thin, inefficient region where price could accelerate upward quickly.
$SUI Did its job in retaking the $1.45 level.
Just needs to get above that $1.6 area now to initate a larger relief bounce. At that point, prices can move quite quickly as the way down as fast and pretty inefficient as well. Lots of untapped lower highs & liquidity. https://t.co/EKftAoXELP pic.twitter.com/iWyLYCdSC7
— Daan Crypto Trades (@DaanCrypto) November 28, 2025
This area contains very little historical resistance, meaning SUI could retrace losses far faster than the initial breakdown. However, if the price continues to struggle below $1.60, the market still holds pockets of untapped lower highs and liquidity, conditions that could drag SUI back down.
Chaotic Price Action Reveals a Fragile Market Structure
The TradingView price chart captures how unstable the structure has been this week. SUI plunged into the low $1.30s before staging an aggressive rebound into the mid $1.50s, yet the recovery remains choppy and inconsistent.
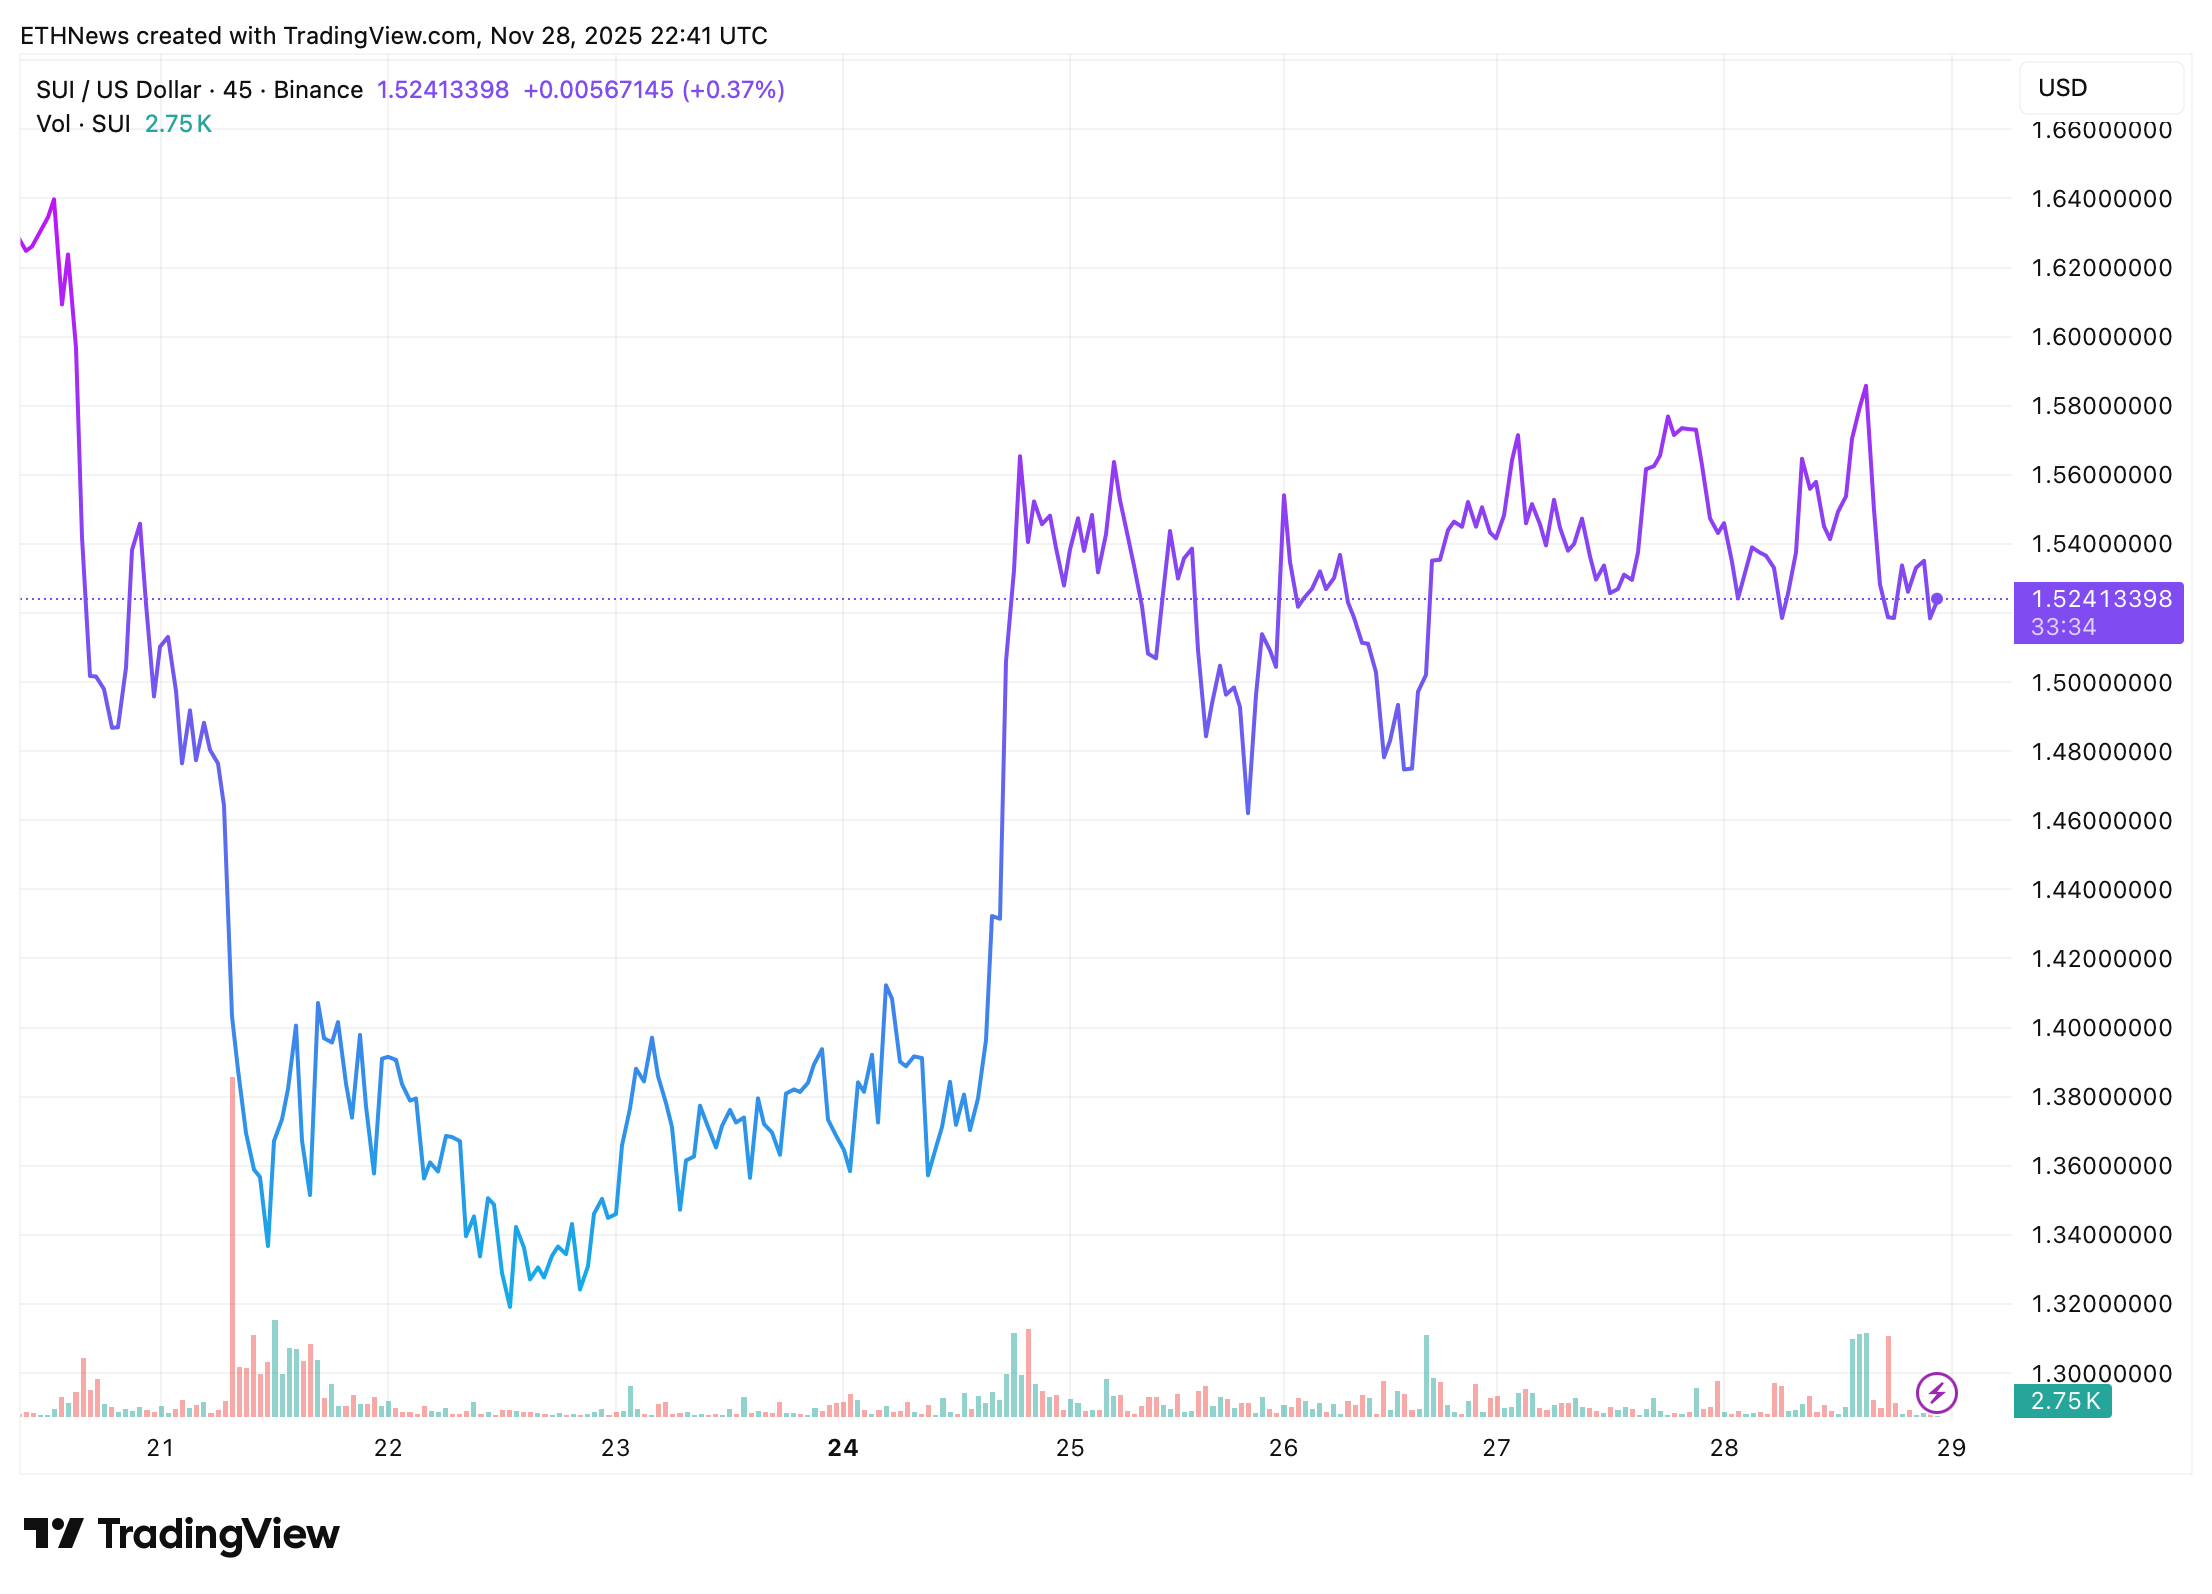
The overlapping purple trendline reflects sudden drops, rapid reversals, and hesitation in reclaiming higher levels. SUI’s rebound is notable, but the broader downtrend remains intact.
Sentiment, Volatility, and Indicators Signal a High-Risk Environment
Market sentiment confirms how fragile conditions are. Data shows SUI in a bearish environment, with the broader market registering Extreme Fear at a 25 reading on the Fear & Greed Index. Volatility is elevated at 17.7%, and only 43% of the last 30 days have closed green. The 14-day RSI at 35.30 is hovering near oversold territory, a level that often precedes temporary bounces but does not guarantee sustained strength.
Long-Term Trend Shows Significant Structural Damage
Higher timeframe analysis reveals deeper challenges. SUI is trading well below major moving averages, with the 50-day SMA at $2.23 and the 200-day SMA at $2.96, both far above current prices. Even a strong short-term rally toward the $1.80–$2.00 region would still be considered a relief move rather than a full trend reversal. CoinCodex’s model projects $1.17, signaling another potential 24% downside unless the market invalidates this outlook with a breakout above resistance.
SUI’s Future Depends on One Level
The reclaim of $1.45 proves buyers are still active, but the direction from here hinges on a single level: $1.60.
Break above it, and SUI finally gains breathing room for a stronger bounce.
Fail to reclaim it, and pressure builds again toward the lower liquidity zones that remain untested.
SUI stands at a critical turning point, and its next move will be defined by that resistance line.


