


Bitcoin is entering one of its most sensitive macro-driven weeks in recent months as Japan prepares to announce its interest rate decision on January 23.
With BTC already showing signs of technical exhaustion near key resistance, the policy outcome could act as the catalyst that determines whether the market enters a deeper corrective phase or squeezes out one final upside extension.
$98K Resistance Rejection Signals Growing Downside Risk
As highlighted on the chart, the $98,000 level has repeatedly acted as a critical ceiling for Bitcoin. The latest advance stalled just below this zone, with price reversing lower from approximately $97,950. This rejection reinforces the importance of the level and suggests buyers were unable to reclaim control at higher valuations.
From a structural perspective, Bitcoin is now drifting lower while still trading above a major ascending trendline that has defined the bull structure for years. This places the market at a decisive inflection point rather than in a confirmed breakdown.
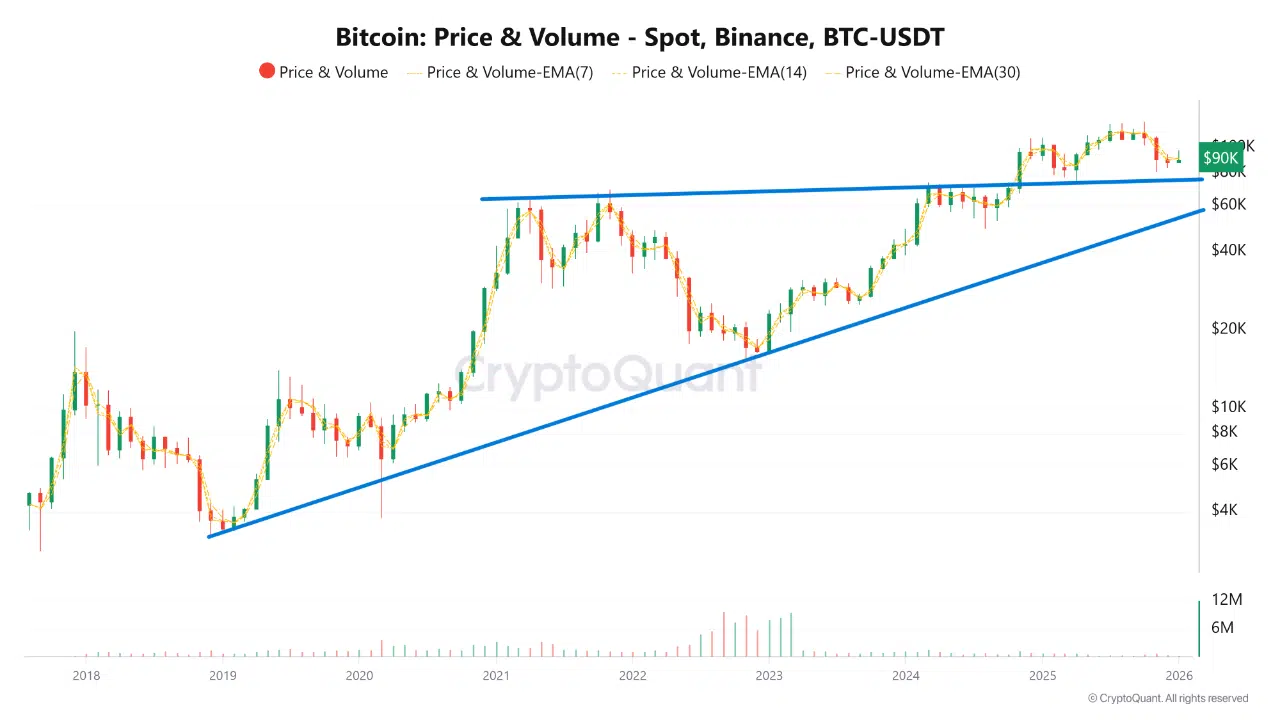
$88,450 Trendline Is the Line in the Sand
The most important level to monitor from here is the rising trend support near $88,450. This trend has acted as a backbone for Bitcoin’s long-term structure, absorbing selling pressure during previous corrections.
If BTC decisively trades below this trendline, it would mark a technical confirmation that the primary downtrend has begun. In that scenario, price action would likely transition into a sideways-to-downward structure, with momentum gradually pushing toward the $69,000 support zone highlighted by the blue horizontal level on the chart.
Macro Pressure From Japan’s Rate Decision
Japan’s interest rate decision adds an additional layer of risk to an already fragile setup. A rate hike that aligns with expectations could strengthen the yen and tighten global liquidity conditions, increasing selling pressure across risk assets, including Bitcoin. With BTC already rejected at resistance, such a macro trigger could accelerate a break below trend support.
Alternative Scenario: One Last Push Higher
If price instead holds above the $88,450 trend and buyers step in aggressively, Bitcoin could still attempt a final upside move. A rebound from this trend may open the door for a push into the $102,000–$110,000 range. However, even in this bullish scenario, the structure suggests that such a move would likely represent a final distribution phase rather than the start of a new sustained uptrend.
Long-Term Bear Market Risk Below
Should the broader downtrend fully develop, the chart points to a much deeper potential retracement. The long-term rising trend that has been intact since 2018 intersects in the $49,000–$52,000 region, which could act as a cyclical bear market bottom if macro and liquidity conditions deteriorate further.
With resistance already respected and macro uncertainty rising, Bitcoin is now in a high-stakes zone where both policy decisions and technical levels are aligned. The coming days may define the market’s direction for much longer than a single weekly candle.


