


Bitcoin’s liquidation landscape is increasingly asymmetric, with a large concentration of short leverage stacked above the current price.
The exchange liquidation map shows that if Bitcoin pushes back toward the $100,000 level, the market could be forced to unwind a significant amount of bearish positioning in a short time frame.
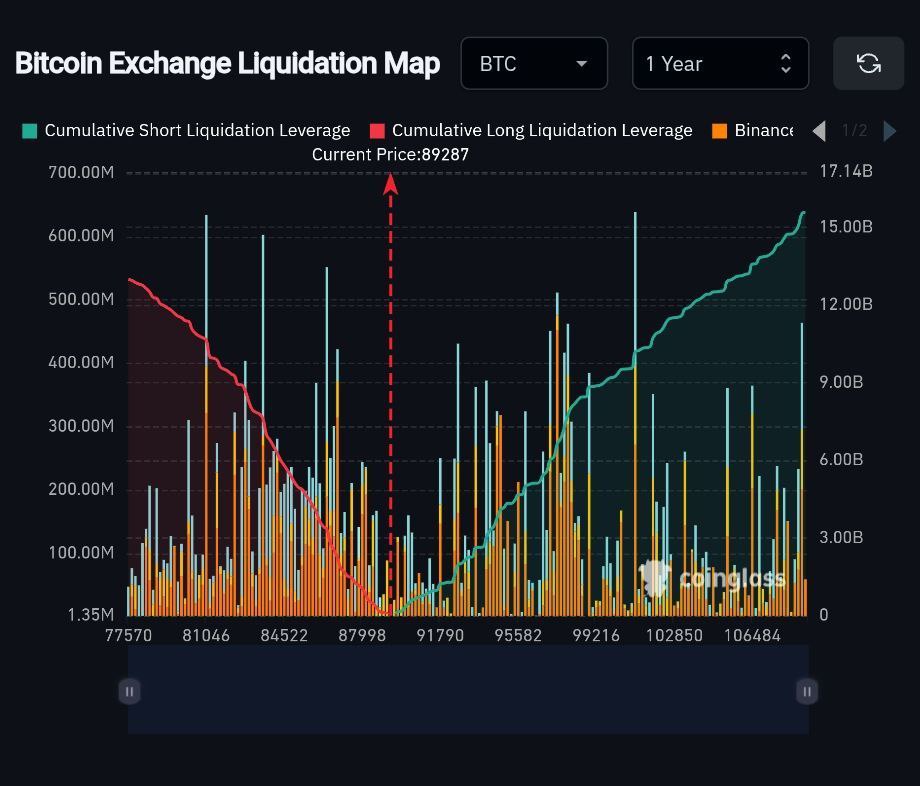
At the current price near $88,600, the chart highlights a clear imbalance between cumulative short and long liquidation leverage. On the upside, the green curve representing cumulative short liquidations rises sharply as price approaches the $100K zone, while downside long liquidations appear comparatively lighter and more dispersed.
What the Liquidation Map Is Revealing
The vertical bars represent liquidation clusters across different price levels, while the cumulative lines show how leverage builds as price moves. Above $95,000, short liquidation leverage accelerates rapidly, culminating in roughly $9.5 billion in potential short liquidations near $100,000.
This structure suggests that a large number of traders are positioned against Bitcoin at higher levels, likely expecting continued downside or range-bound behavior. As price moves upward, these positions become increasingly fragile, creating conditions where forced buying could compound momentum rather than slow it.
Why the $100K Area Stands Out
The chart makes it clear that $100,000 is not just a psychological level, but a liquidity inflection point. A move into this zone would pressure short sellers simultaneously, increasing the probability of cascading liquidations rather than isolated position closures.
Importantly, this does not imply that Bitcoin must immediately reach or break $100K. Instead, it highlights how positioning has evolved: downside risk appears more incremental, while upside risk is clustered and nonlinear due to leverage concentration.
Positioning, Not Prediction
This setup reflects market structure, not a price forecast. The data shows where forced flows could emerge if price advances, not a guarantee that it will happen.
However, the presence of such a large short liquidation pocket indicates that any sustained upside move could be mechanically reinforced by leverage dynamics rather than purely discretionary buying.
In short, the liquidation map suggests that Bitcoin’s risk profile is currently skewed, limited forced selling below, but significant forced buying potential above, making the $100K region a critical area for market positioning and volatility.


