


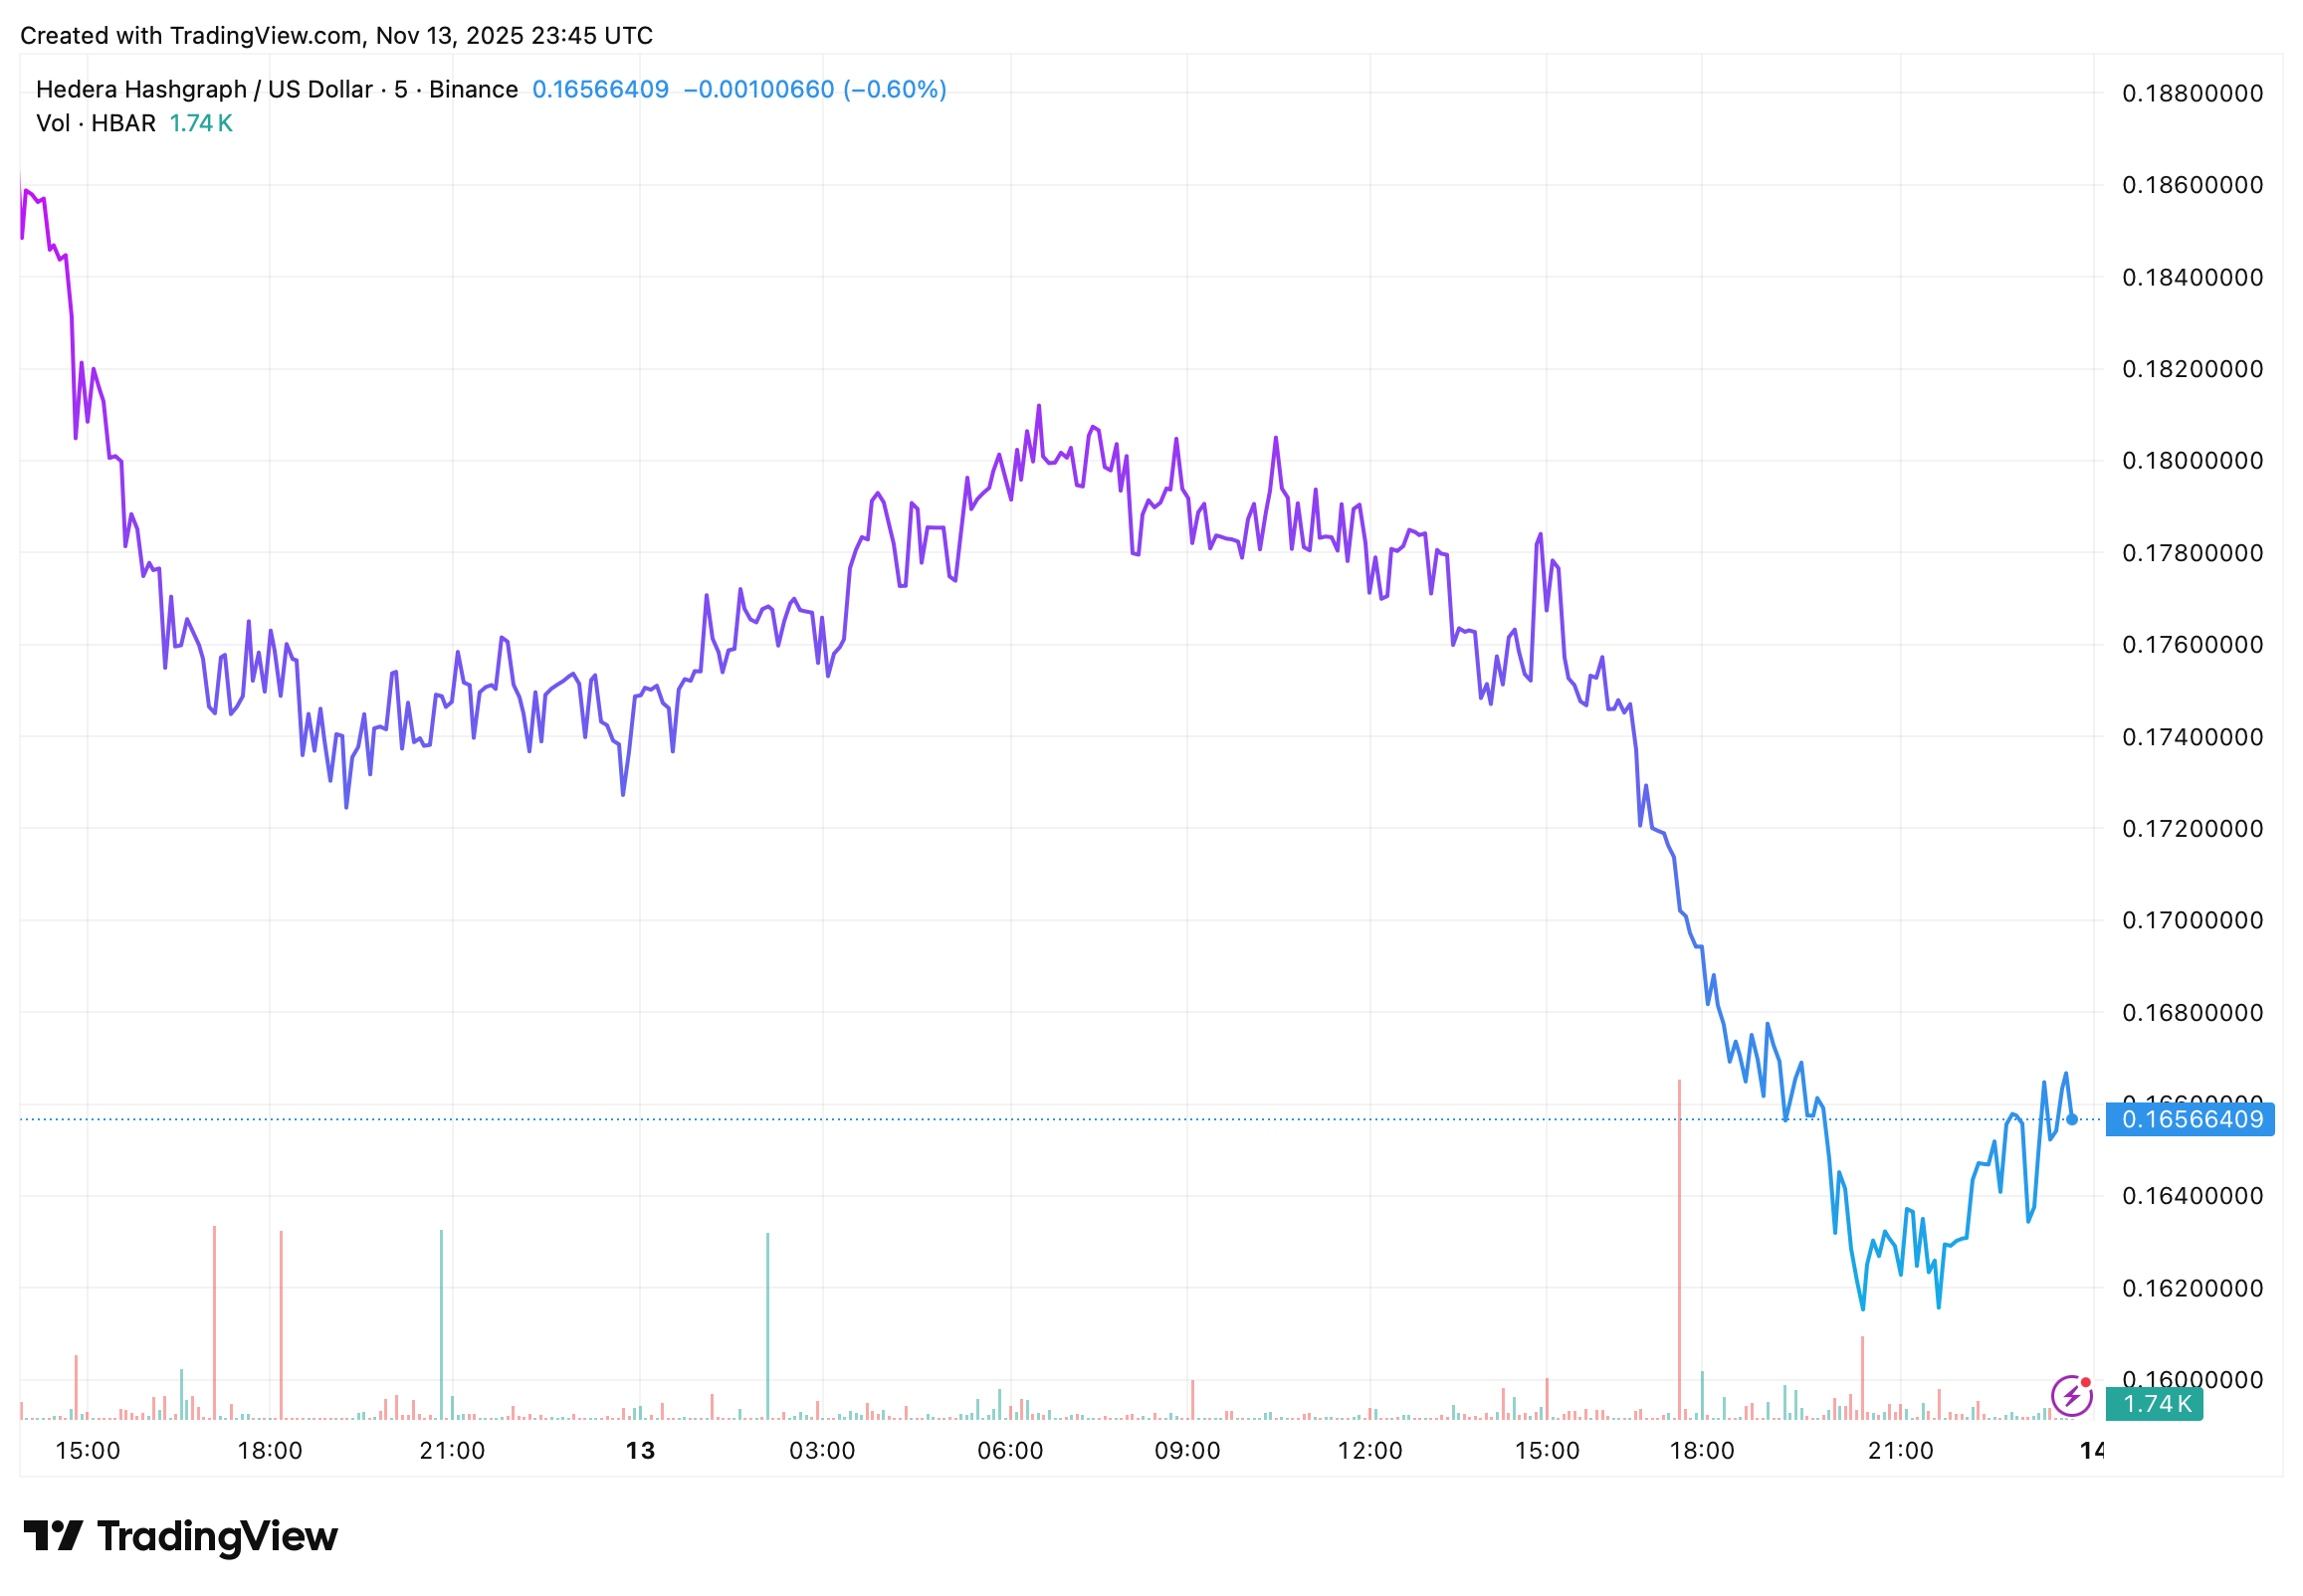
Hedera (HBAR) is trading around $0.16, down 4.2% over the past 24 hours, as the broader crypto market remains under heavy selling pressure. The chart shows a clear intraday downtrend driven by rising volume on sell-offs, signaling persistent bearish sentiment. Despite a late-session bounce, momentum remains weak and buyers have not yet regained control.
HBAR Falls Through Key Intraday Support Levels
The TradingView 5-minute chart shows HBAR losing its early high near $0.184, followed by a steady decline through multiple minor support zones. The sharp breakdown begins after the 15:00 UTC mark, where price accelerates downward with increasing sell volume. This suggests liquidation-driven or momentum-driven selling, not just organic profit-taking.
HBAR eventually reaches a low around $0.16, marking a nearly 12% swing from its intraday peak. The rebound from that level shows buyers stepping in, but the recovery remains shallow relative to the earlier decline.
Volume Profile Confirms Bearish Momentum
Volume spiked significantly during the strongest portion of the sell-off – exactly what you want to see if bears are in control.
Key observations:
- High red-volume candles align with downward price acceleration.
- Green-volume spikes appear mostly at bottoms, not breakouts, indicating reactionary buying, not trend reversal.
- 24h volume jumped +18%, confirming elevated trading activity and distribution pressure.
This volume pattern typically appears in corrections that are not yet complete.
Market Structure: Lower Highs and Lower Lows Dominate
Across the entire chart, HBAR consistently forms:
- Lower highs
- Lower lows
- Breakdowns occurring sooner than recoveries
This is classic bearish market structure.
The uptrend that began at the day’s midpoint fails to break above any prior resistance, which means the bounce is corrective rather than trend-building.
Unless HBAR closes above $0.172–$0.175, the structure remains decisively bearish.
HBAR Market Cap Drops as Selling Pressure Intensifies
HBAR’s market cap fell 4.5% to $7.05B, while its unlocked market cap is now slightly higher at $7.6B.
This divergence implies:
- Circulating supply is stable
- Price decline is solely demand-driven
- Hedera is losing speculative bid strength in sync with the broader altcoin market
Meanwhile, the Fully Diluted Value (FDV) at $8.3B amplifies investor caution, high FDV tokens often face steeper drawdowns during liquidity shocks.
Short-Term Outlook: Can HBAR Hold the $0.16–$0.165 Demand Zone?
The bounce from $0.16 is constructive, but not yet convincing.
Here’s what matters next:
Bullish Signal (Not Yet Confirmed):
A recovery above $0.175 with strong volume would mark the first higher high and suggest potential trend reversal.
Bearish Risk (More Likely Short-Term):
A drop back below $0.165 reopens the path toward:
- $0.158
- $0.150 psychological support
Given the declining structure, the bearish scenario currently has higher probability.
Conclusion: Hedera Shows Early Signs of Stabilization, but Bears Still Control the Market
HBAR remains under clear short-term bearish momentum after losing its intraday highs and breaking multiple support levels. Rising sell volume confirms strong downward pressure, and the rebound from $0.16 is not yet strong enough to signal a real recovery. Until HBAR reclaims the $0.175 resistance, traders should expect volatility and further downside risk, especially as macro-driven market weakness continues to weigh on altcoins.


