


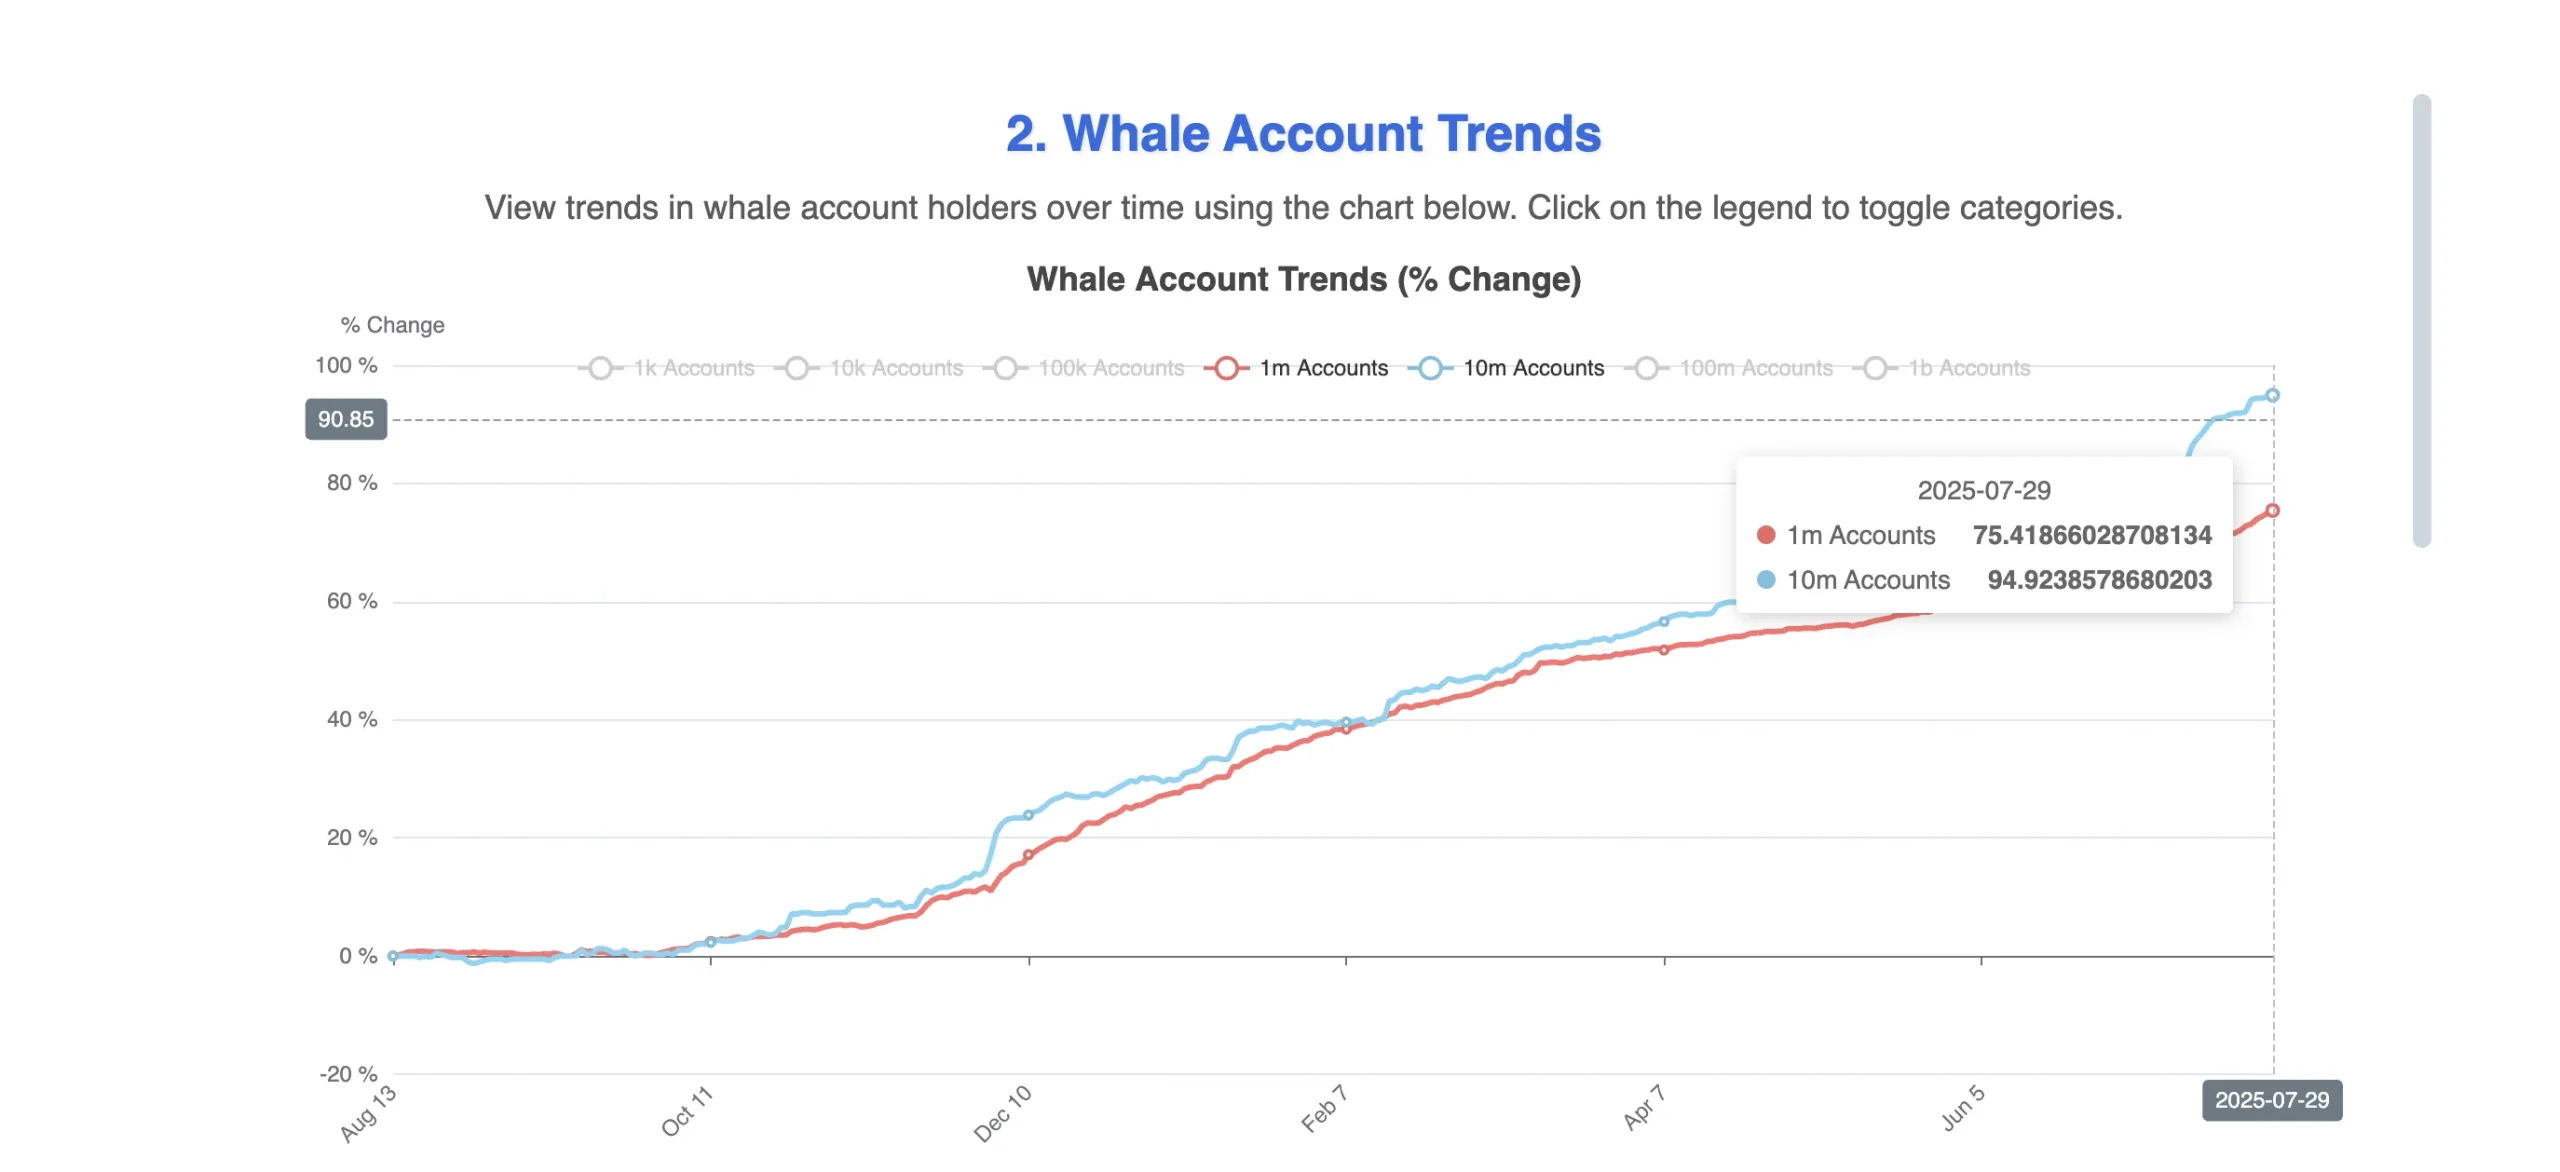
- HBAR whales increased holdings by 5% since July 20, suggesting strategic buying during the 10% price dip.
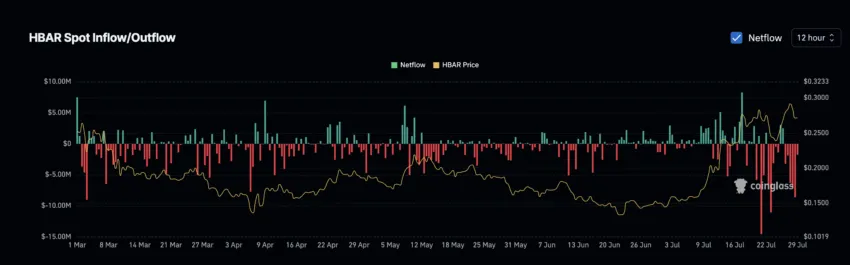
- More HBAR leaving exchanges than entering indicates whales are storing rather than selling their tokens.
Hedera (HBAR) has declined 10% from its recent five-month high of $0.30, yet on-chain data suggests large investors are increasing their holdings. Since July 20, wallets holding at least 1 million HBAR rose by nearly 5%, while those with 10 million or more grew by 4.5%. This trend indicates accumulation rather than panic selling.
Exchange netflows further support this observation. More HBAR has been withdrawn from exchanges than deposited, reducing immediate sell pressure. Whales appear to be moving tokens into private storage, a pattern often preceding price rebounds.
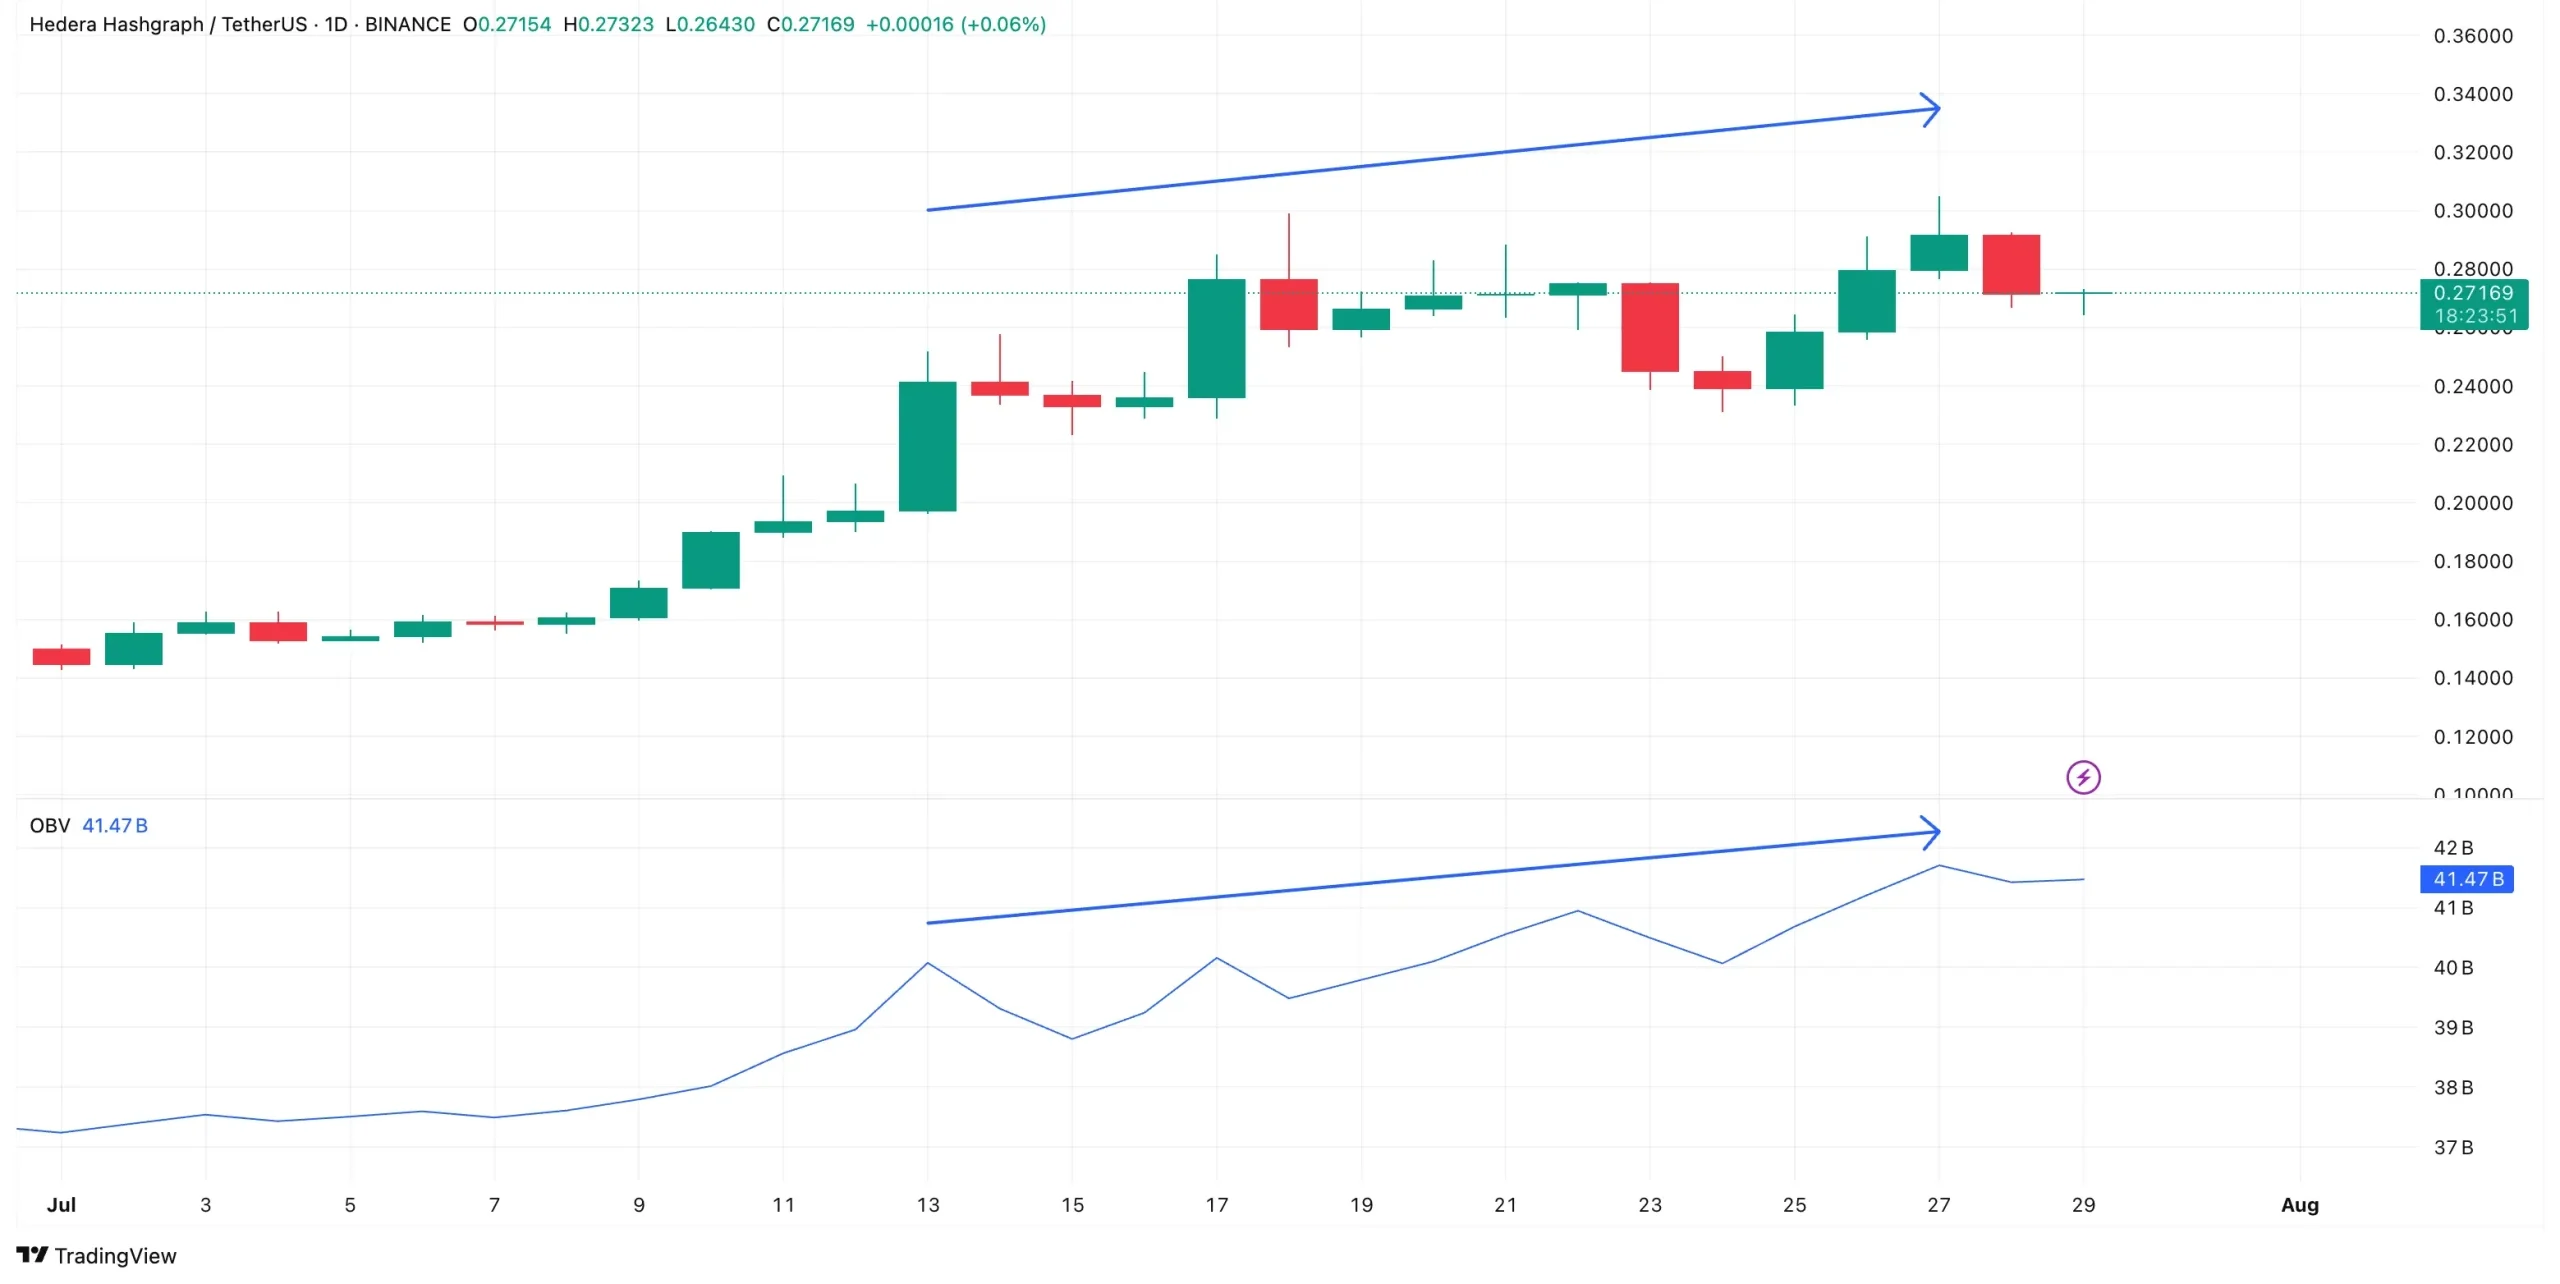
The On-Balance Volume (OBV) indicator reinforces this outlook. Despite the price drop, OBV—which tracks buying and selling volume—has maintained an upward trend since early July. This suggests underlying demand remains intact, even as retail traders lean bearish.
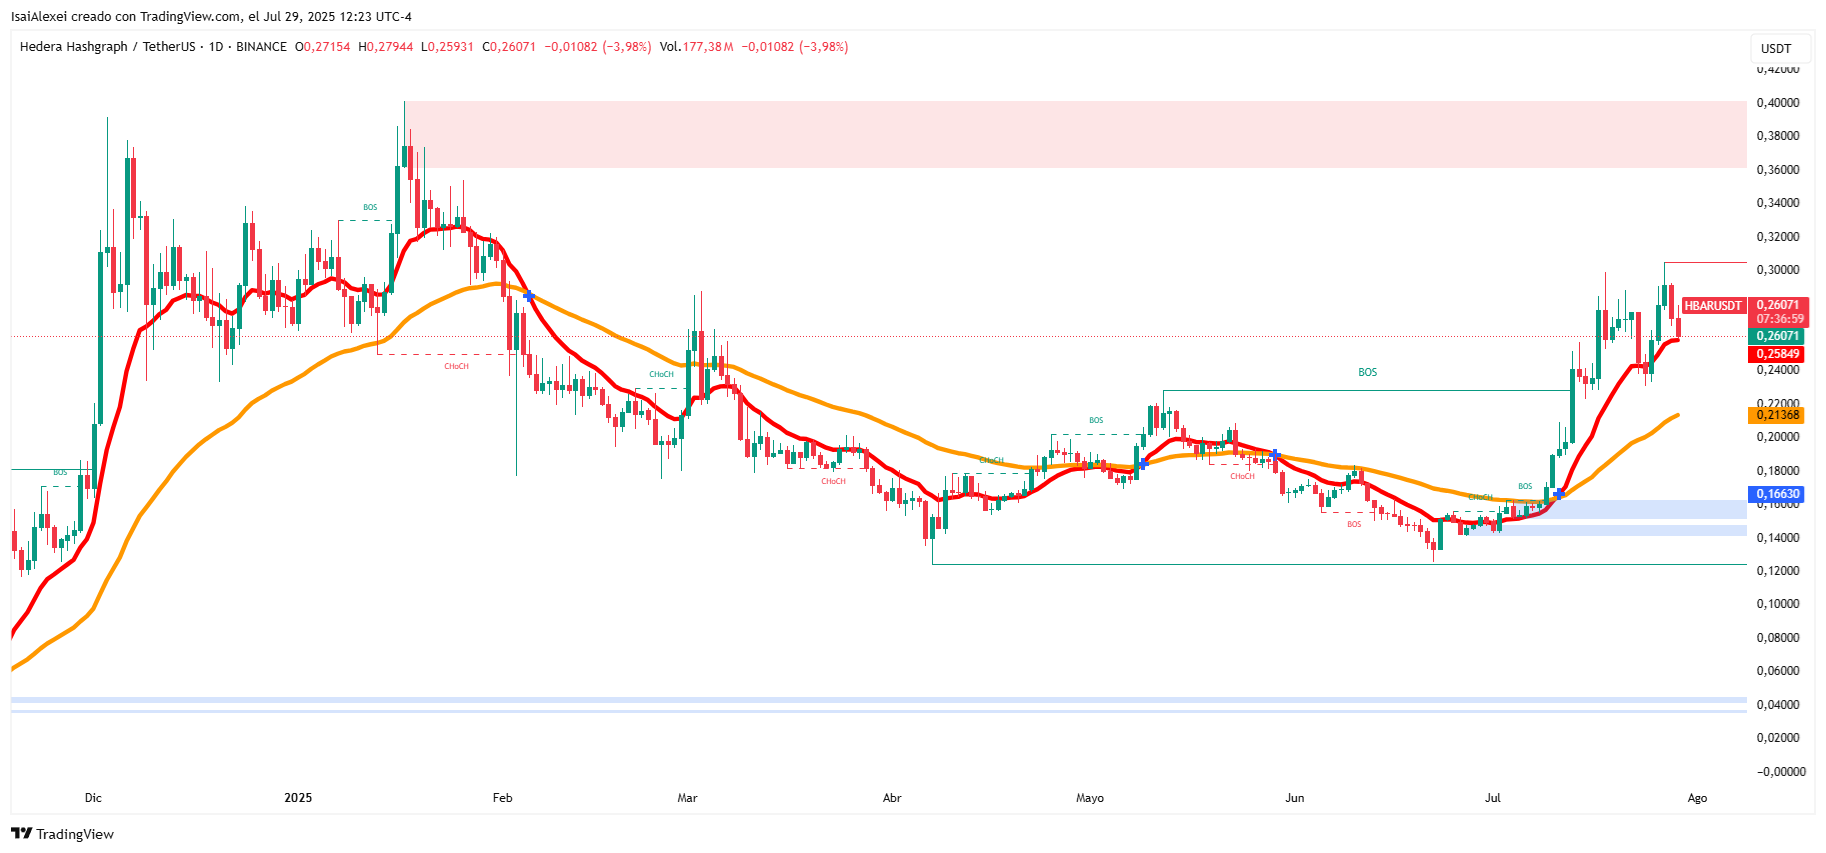
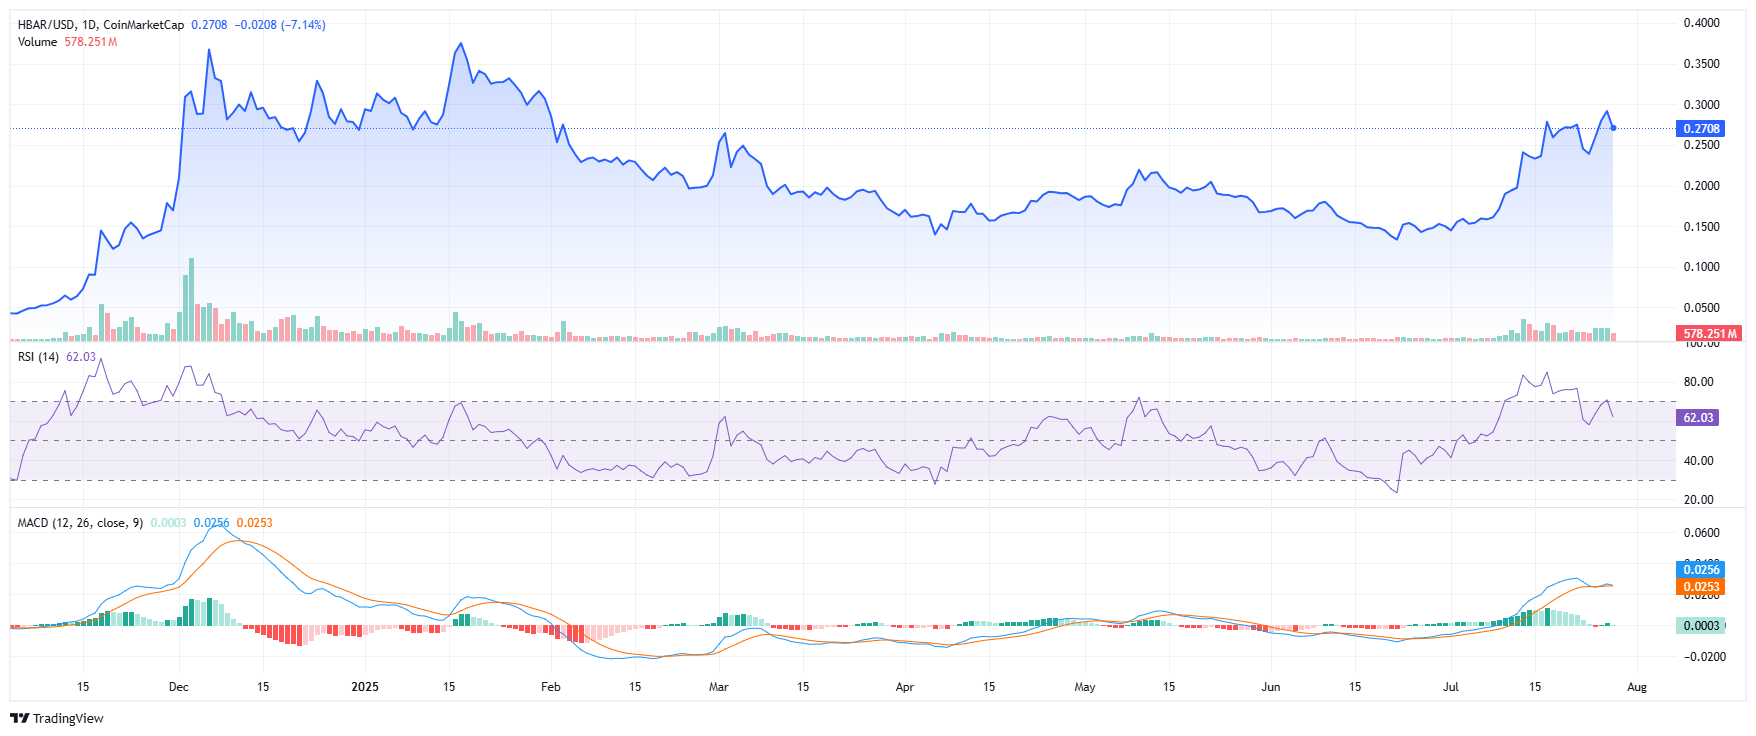
HBAR currently holds above the $0.26 support level, aligned with the 0.236 Fibonacci retracement. Holding this zone could pave the way for a retest of $0.30 if whale accumulation continues. However, a drop below $0.26 would weaken the bullish case.
The divergence between whale activity and retail sentiment suggests the recent dip may be temporary. If accumulation persists, HBAR could see renewed upward momentum in the coming weeks.
Hedera (HBAR) is trading at approximately $0.2608, showing a recent pullback of nearly 4%. The RSI (14) is at 58.5, placing it in neutral territory—neither overbought nor oversold—which indicates potential room for further moves without immediate exhaustion. The MACD (12, 26) is slightly bearish, with a value of 0.0239 signaling some short-term downward momentum.
Short-term EMAs (10-day) and SMAs (10-day) are in sell territory, indicating recent weakness, while medium- to long-term averages (20, 30, 50, 100, and 200) are all in buy territory. This suggests that the broader trend remains bullish despite the short-term correction.
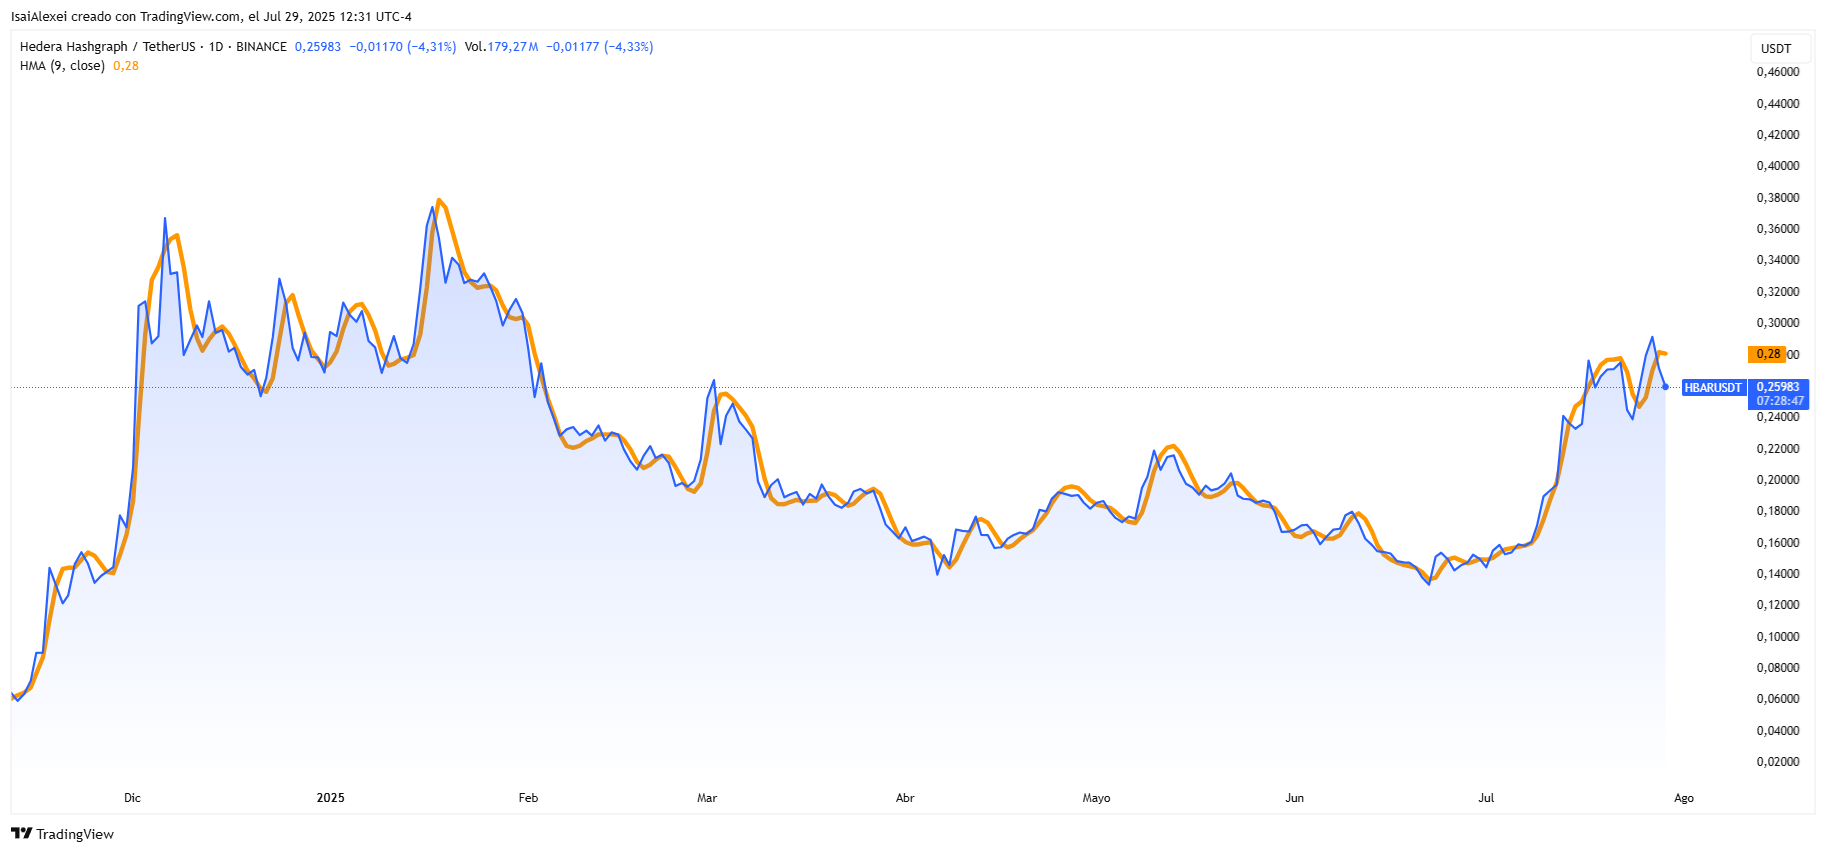
The Hull Moving Average (9) is in sell mode, reinforcing the likelihood of near-term consolidation or minor downside before resuming the uptrend.
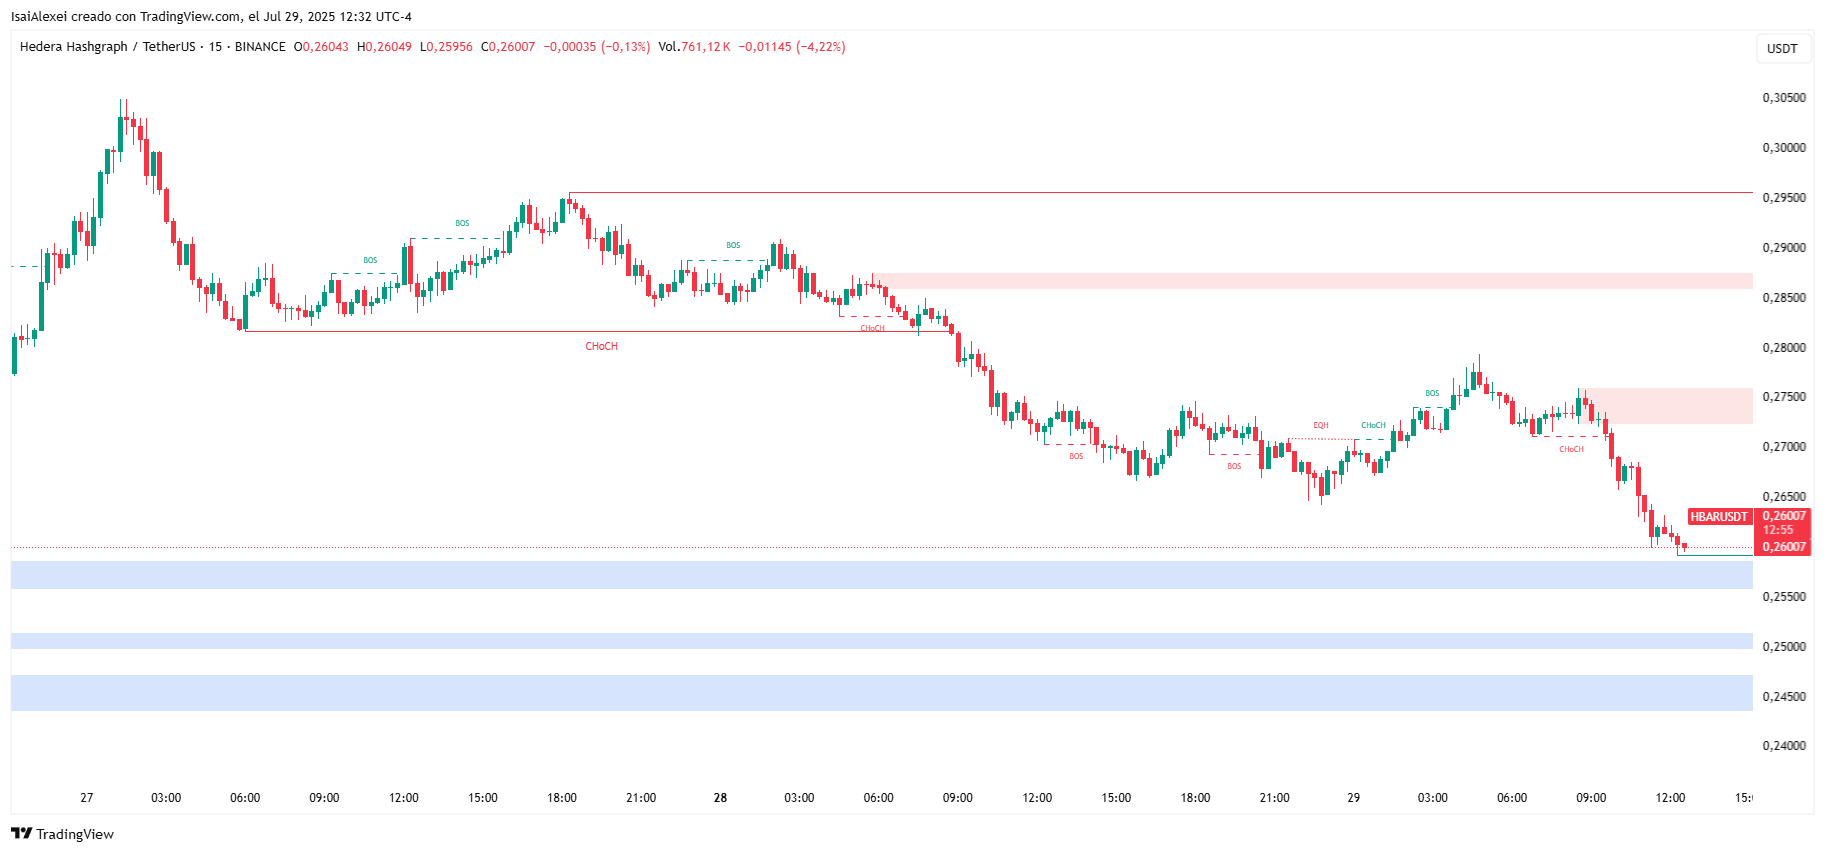
Support levels are noted around $0.24–$0.25, while resistance sits closer to $0.27. The overall technical structure shows that HBAR remains in a medium-term bullish trend but faces short-term pressure, which could either lead to a healthy retracement or sideways consolidation before attempting another breakout.


