


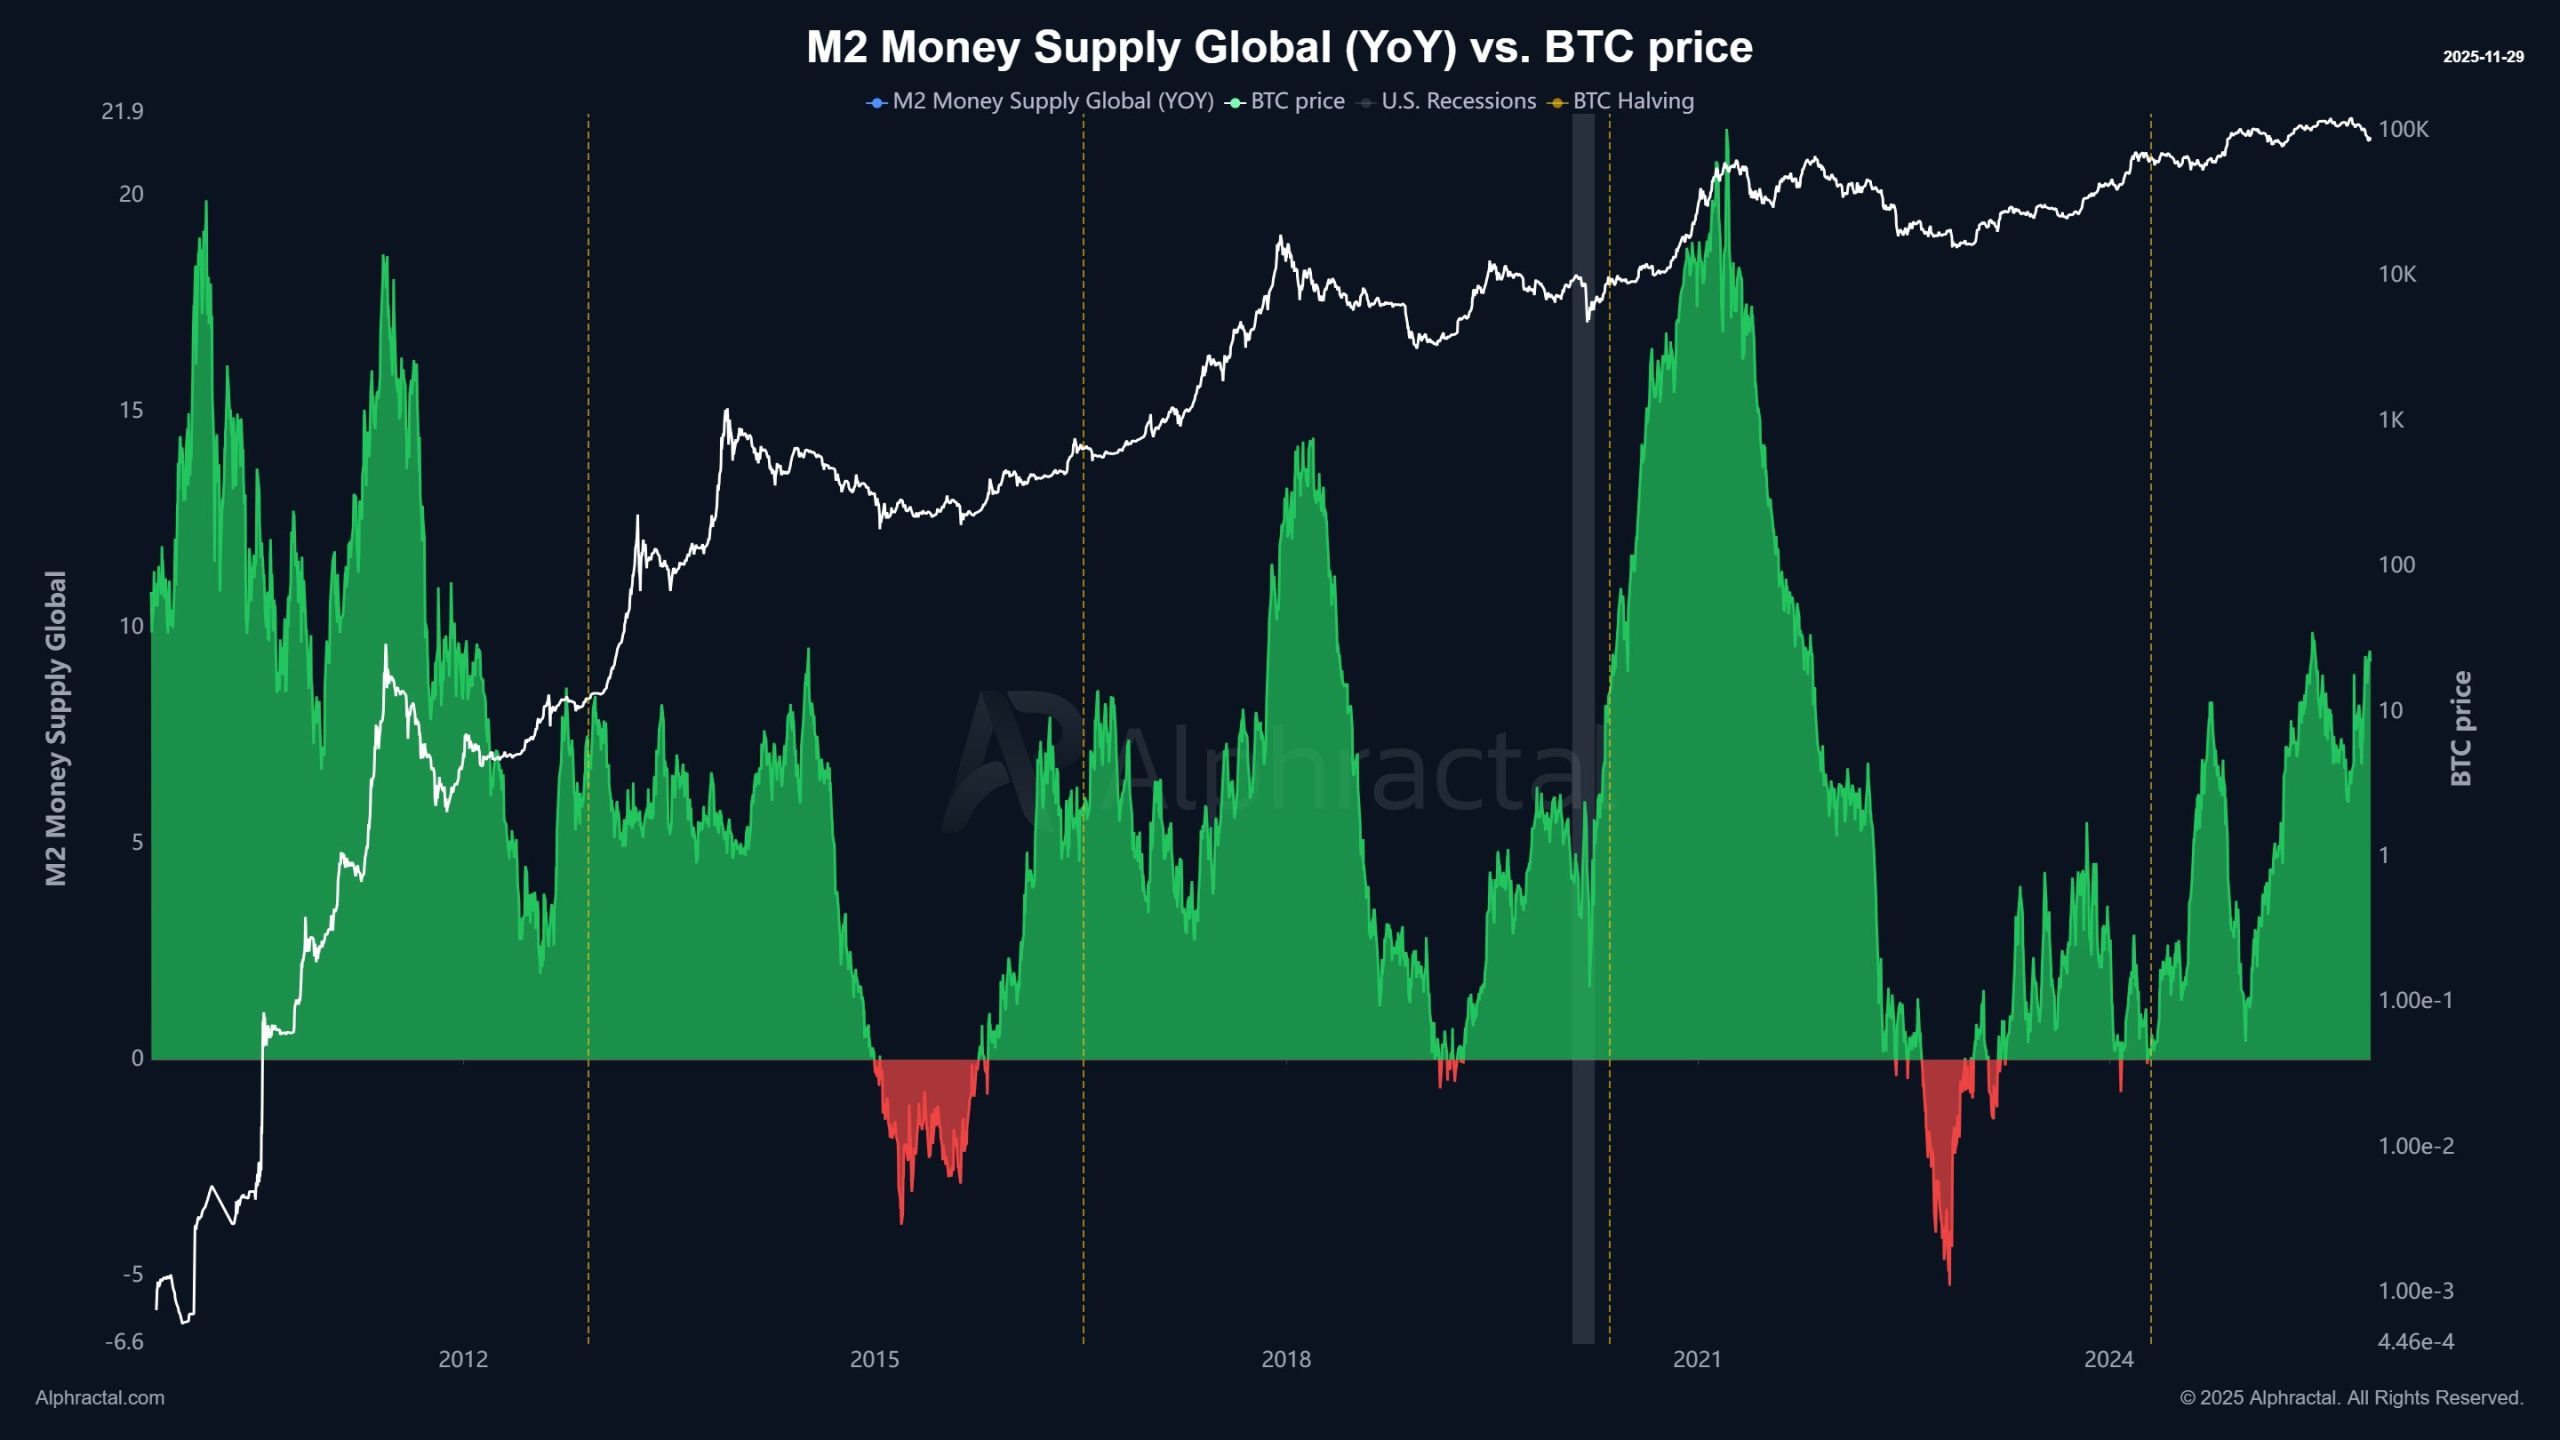
A new set of macro-on-chain visuals released by Alphractal is putting the spotlight back on one of Bitcoin’s most reliable long-term drivers: global liquidity. The platform’s latest update maps the 1-year rate-of-change in Global M2 money supply directly against Bitcoin’s price, revealing an unmistakable relationship that has repeated across every major cycle.
Liquidity Cycles Continue to Shape Bitcoin’s Path
The chart shows that whenever global M2 accelerates (the green zones), Bitcoin has historically entered strong expansion phases. Conversely, periods of contracting liquidity (the red zones) have aligned with painful drawdowns and macro stress.
The newly updated comparison also overlays major recession windows and halving events, highlighting how Bitcoin has repeatedly surged after liquidity bottoms and then accelerates once M2 growth picks up speed.
Alphractal Adds Easy Rate-of-Change Tools
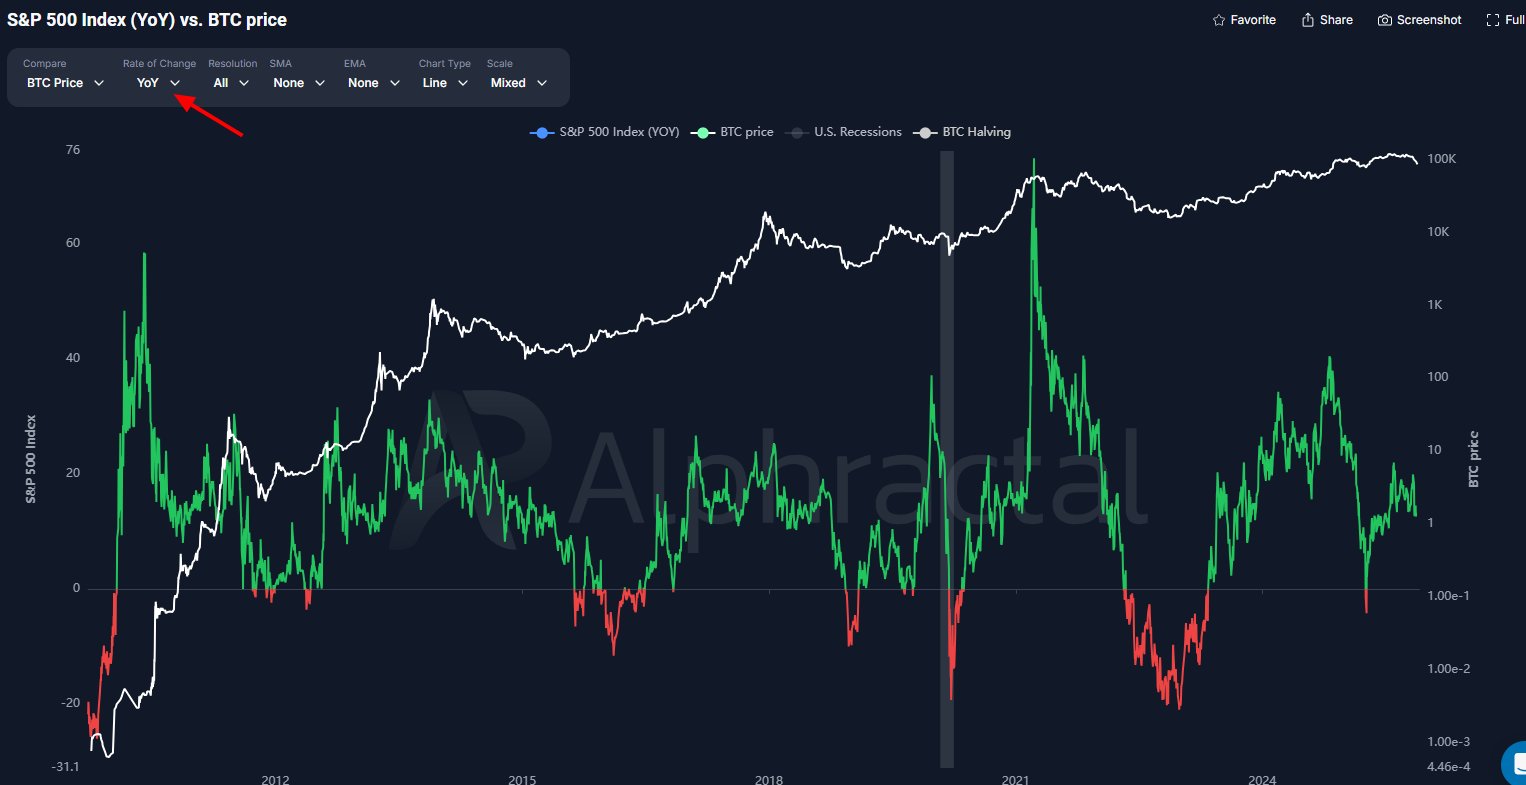
Alphractal is integrating this visual logic directly into its analytics suite. Users will be able to apply rate-of-change filters, YoY, QoQ, MoM, and more, to a wide range of metrics including macro indicators, sentiment, and on-chain activity.
This makes it significantly easier to compare different time periods and identify the underlying forces driving each phase of Bitcoin’s market structure.
Why This Matters Now
Global liquidity has been gradually recovering in 2024–2025, and Bitcoin has mirrored that trend with a slow but steady resurgence. The latest Alphractal data suggests that if M2 expansion continues to strengthen, Bitcoin could be entering another favorable macro environment, similar to the setups in 2016–2017, 2020–2021, and early 2024.
The takeaway is simple but powerful: When liquidity flows, Bitcoin follows.


