


Some of the sharpest market drawdowns in crypto history stand out not because of their size, but because of how quickly they unfolded.
Data ranking the top 15 fastest crashes by peak velocity (ROC Z-Score) shows that speed, rather than absolute volume, is often the defining stress factor during sudden sell-offs. The chart also highlights a recurring pattern: the most rapid declines tend to normalize faster than slower, drawn-out crashes.
Solana Dominates High-Velocity Sell-Offs
Solana appears most frequently in the ranking, accounting for five separate entries among the fastest crashes recorded.
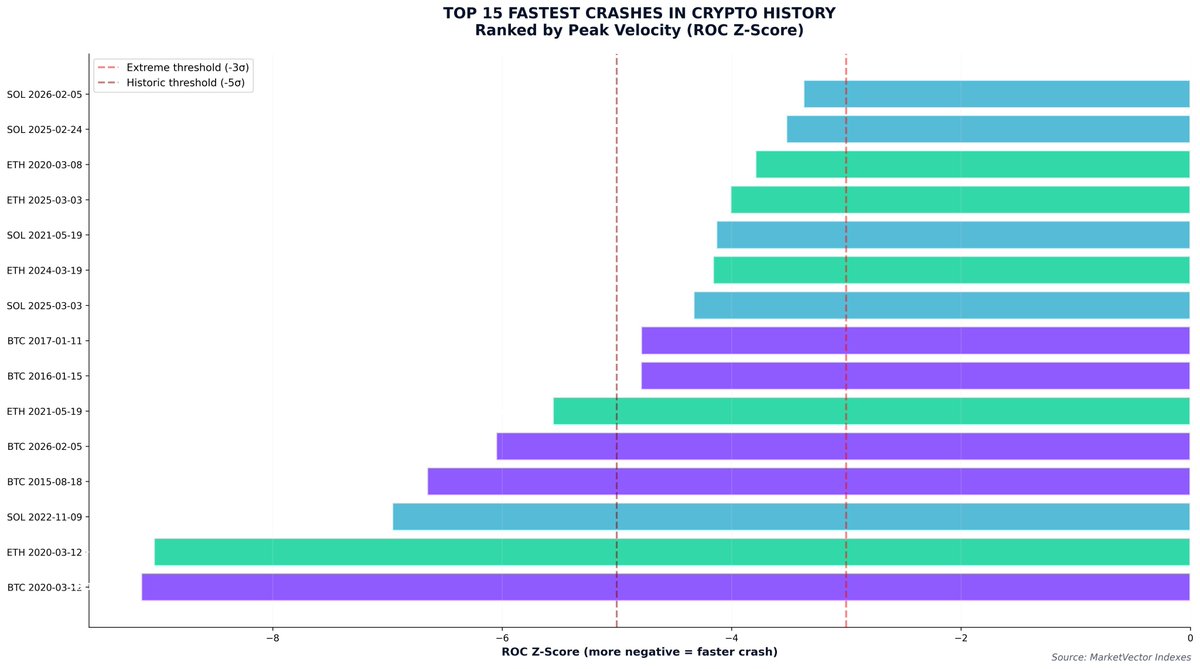
These events cluster toward the extreme end of the ROC Z-Score scale, indicating abrupt downside moves occurring over very short time windows. The repeated presence of Solana suggests that its historical volatility profile allows for sharper downside accelerations compared with other large-cap assets, even if those moves are not always the most capital-intensive.
Ethereum also features multiple times in the list, reinforcing that high-liquidity assets are not immune to sudden velocity-driven dislocations. These episodes reflect moments where market positioning unwound rapidly, pushing price changes beyond historic velocity thresholds.
Bitcoin’s Volume Record Still Stands
While Solana dominates in terms of speed, Bitcoin’s March 2020 crash remains unmatched in terms of sheer volume and historical significance. The chart places this event at the most extreme end of the ROC Z-Score distribution, marking it as the fastest and most severe velocity shock on record. This move coincided with the broader COVID-driven liquidity crisis, when forced selling cascaded across global markets simultaneously.
Several other Bitcoin entries appear throughout the ranking, showing that although Bitcoin crashes may occur less frequently at extreme speeds, when they do, they tend to carry systemic weight.
What the Pattern Suggests
A notable takeaway from the data is that the fastest dumps often recover the quickest. High-velocity crashes typically reflect sudden liquidity vacuums or positioning resets rather than prolonged structural breakdowns. Once selling pressure exhausts itself, price stabilization can follow relatively quickly compared with slower, grinding declines.
From a structural perspective, the chart emphasizes the importance of distinguishing between speed-driven shocks and volume-driven capitulation. While both are disruptive, they carry different implications for recovery dynamics and market behavior in the aftermath.


