


A new technical analysis shared by trader Trader Tardigrade suggests that Ethereum may be entering a decisive phase, as its weekly chart begins to mirror a classic bullish reversal structure.
According to the analysis, Ethereum is forming an inverse head and shoulders pattern on the weekly timeframe, one of the most widely followed long-term bullish formations. This structure typically signals a transition from a corrective phase into a renewed uptrend when confirmed.
Inverse Head and Shoulders Taking Shape
The chart highlights three key components.
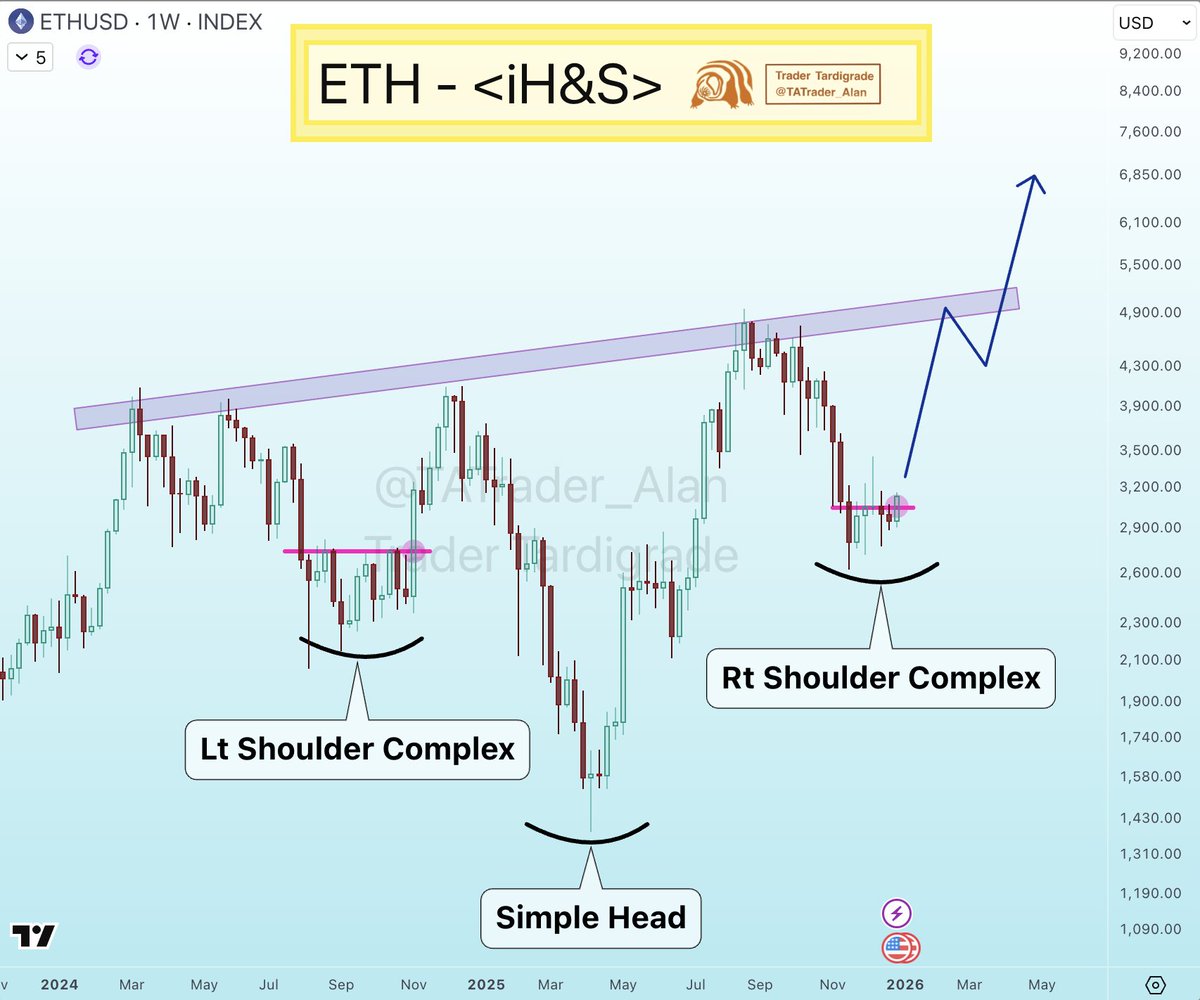
The left shoulder formed during Ethereum’s earlier pullback, followed by a deeper decline that created the head, marking the cycle low. More recently, price action has carved out the right shoulder, which appears structurally similar to the left, an important symmetry that strengthens the setup.
What stands out is the right shoulder complex, where Ethereum has begun to break higher after consolidating above local support. This mirrors the behavior seen during the left shoulder phase and suggests that downside pressure is fading.
Breakout Zone and Structural Resistance
Ethereum is currently pressing into a rising resistance band, the neckline zone of the pattern. This area has capped price advances multiple times in the past, making it the most critical level on the chart.
A clean weekly close above this resistance zone would be the technical confirmation traders look for. Historically, confirmed inverse head and shoulders breakouts often lead to measured moves that extend well beyond prior highs, especially when they appear on higher timeframes like the weekly chart.
Probabilities and What Comes Next
From a technical perspective, the structure implies two main scenarios:
- Bullish continuation: A sustained breakout above the neckline could open the door to a strong upside expansion phase, with momentum accelerating as long-term participants re-enter.
- Failed breakout risk: Rejection at resistance would likely send price back into consolidation, keeping Ethereum range-bound until a clearer catalyst emerges.
For now, the chart suggests that structure favors upside, but confirmation remains key. As the trader notes, this setup is not about short-term noise, it’s about letting the weekly structure play out.
Ethereum’s next few weekly closes may determine whether this developing pattern turns into one of the most significant technical breakouts of the cycle.


