


Ethereum is currently positioned at a technically decisive area, with price reacting from a clearly defined demand zone after an extended decline from range resistance.
The broader structure remains corrective, but short-term price behavior suggests that the market is attempting to stabilize.
The key question now is whether this reaction evolves into a meaningful recovery or simply forms another lower high within the prevailing bearish framework.
Descending Structure Still Intact
According to the chart shared by GainMuse, ETHUSDT remains inside a broader descending channel structure. Price previously failed to sustain strength above the mid-range triangle resistance and subsequently broke down toward the lower boundary of the channel.
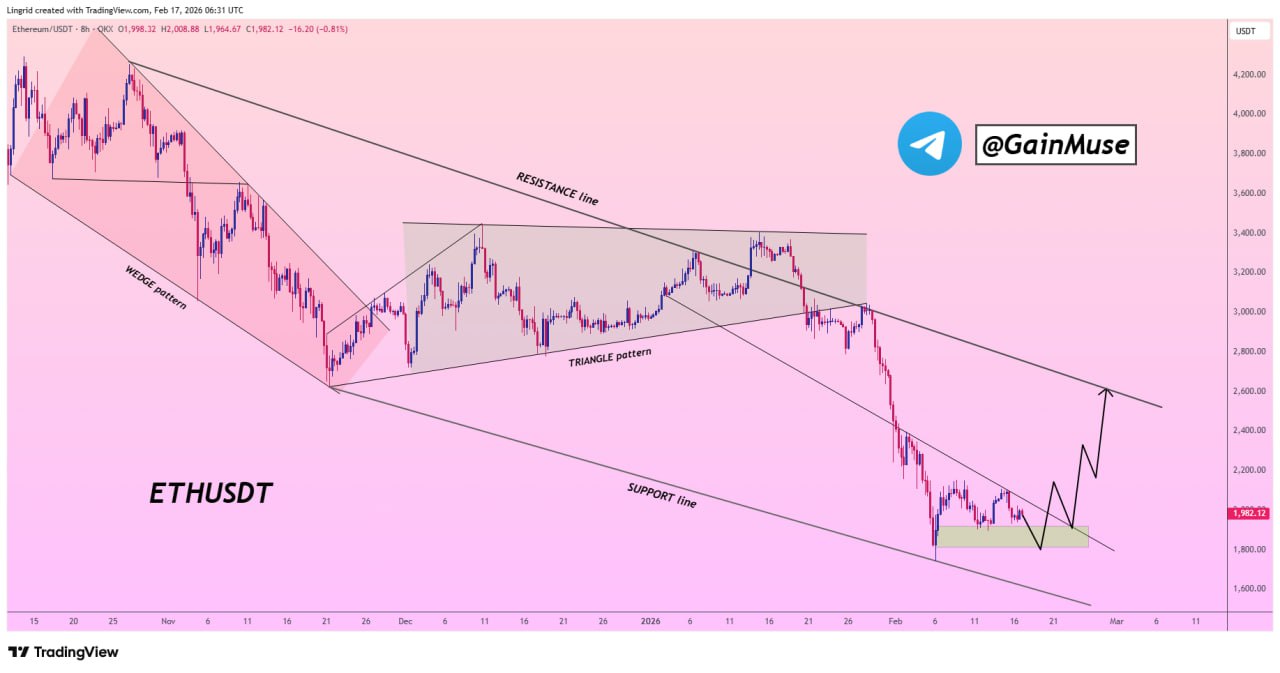
The chart highlights several structural elements:
- A prior wedge formation that resolved to the downside
- A mid-range triangle consolidation beneath a resistance line
- A clear descending resistance trendline capping upside attempts
- A defined horizontal demand zone aligned with long-term channel support
The recent selloff pushed Ethereum directly into that highlighted demand area near the lower support line of the channel. The projection drawn on the chart suggests a potential rebound toward the descending resistance trendline, but only if current support holds. If this zone fails, the structure implies continuation lower within the broader bearish framework.
In short, the dominant pattern remains one of lower highs and structural compression under resistance.
Short-Term Stabilization Attempt
On the TradingView 1-hour chart, Ethereum is trading around $1,991 at the time of capture. After a sharp drop earlier in the month, price has transitioned into a consolidation range roughly between $1,950 and $2,020.
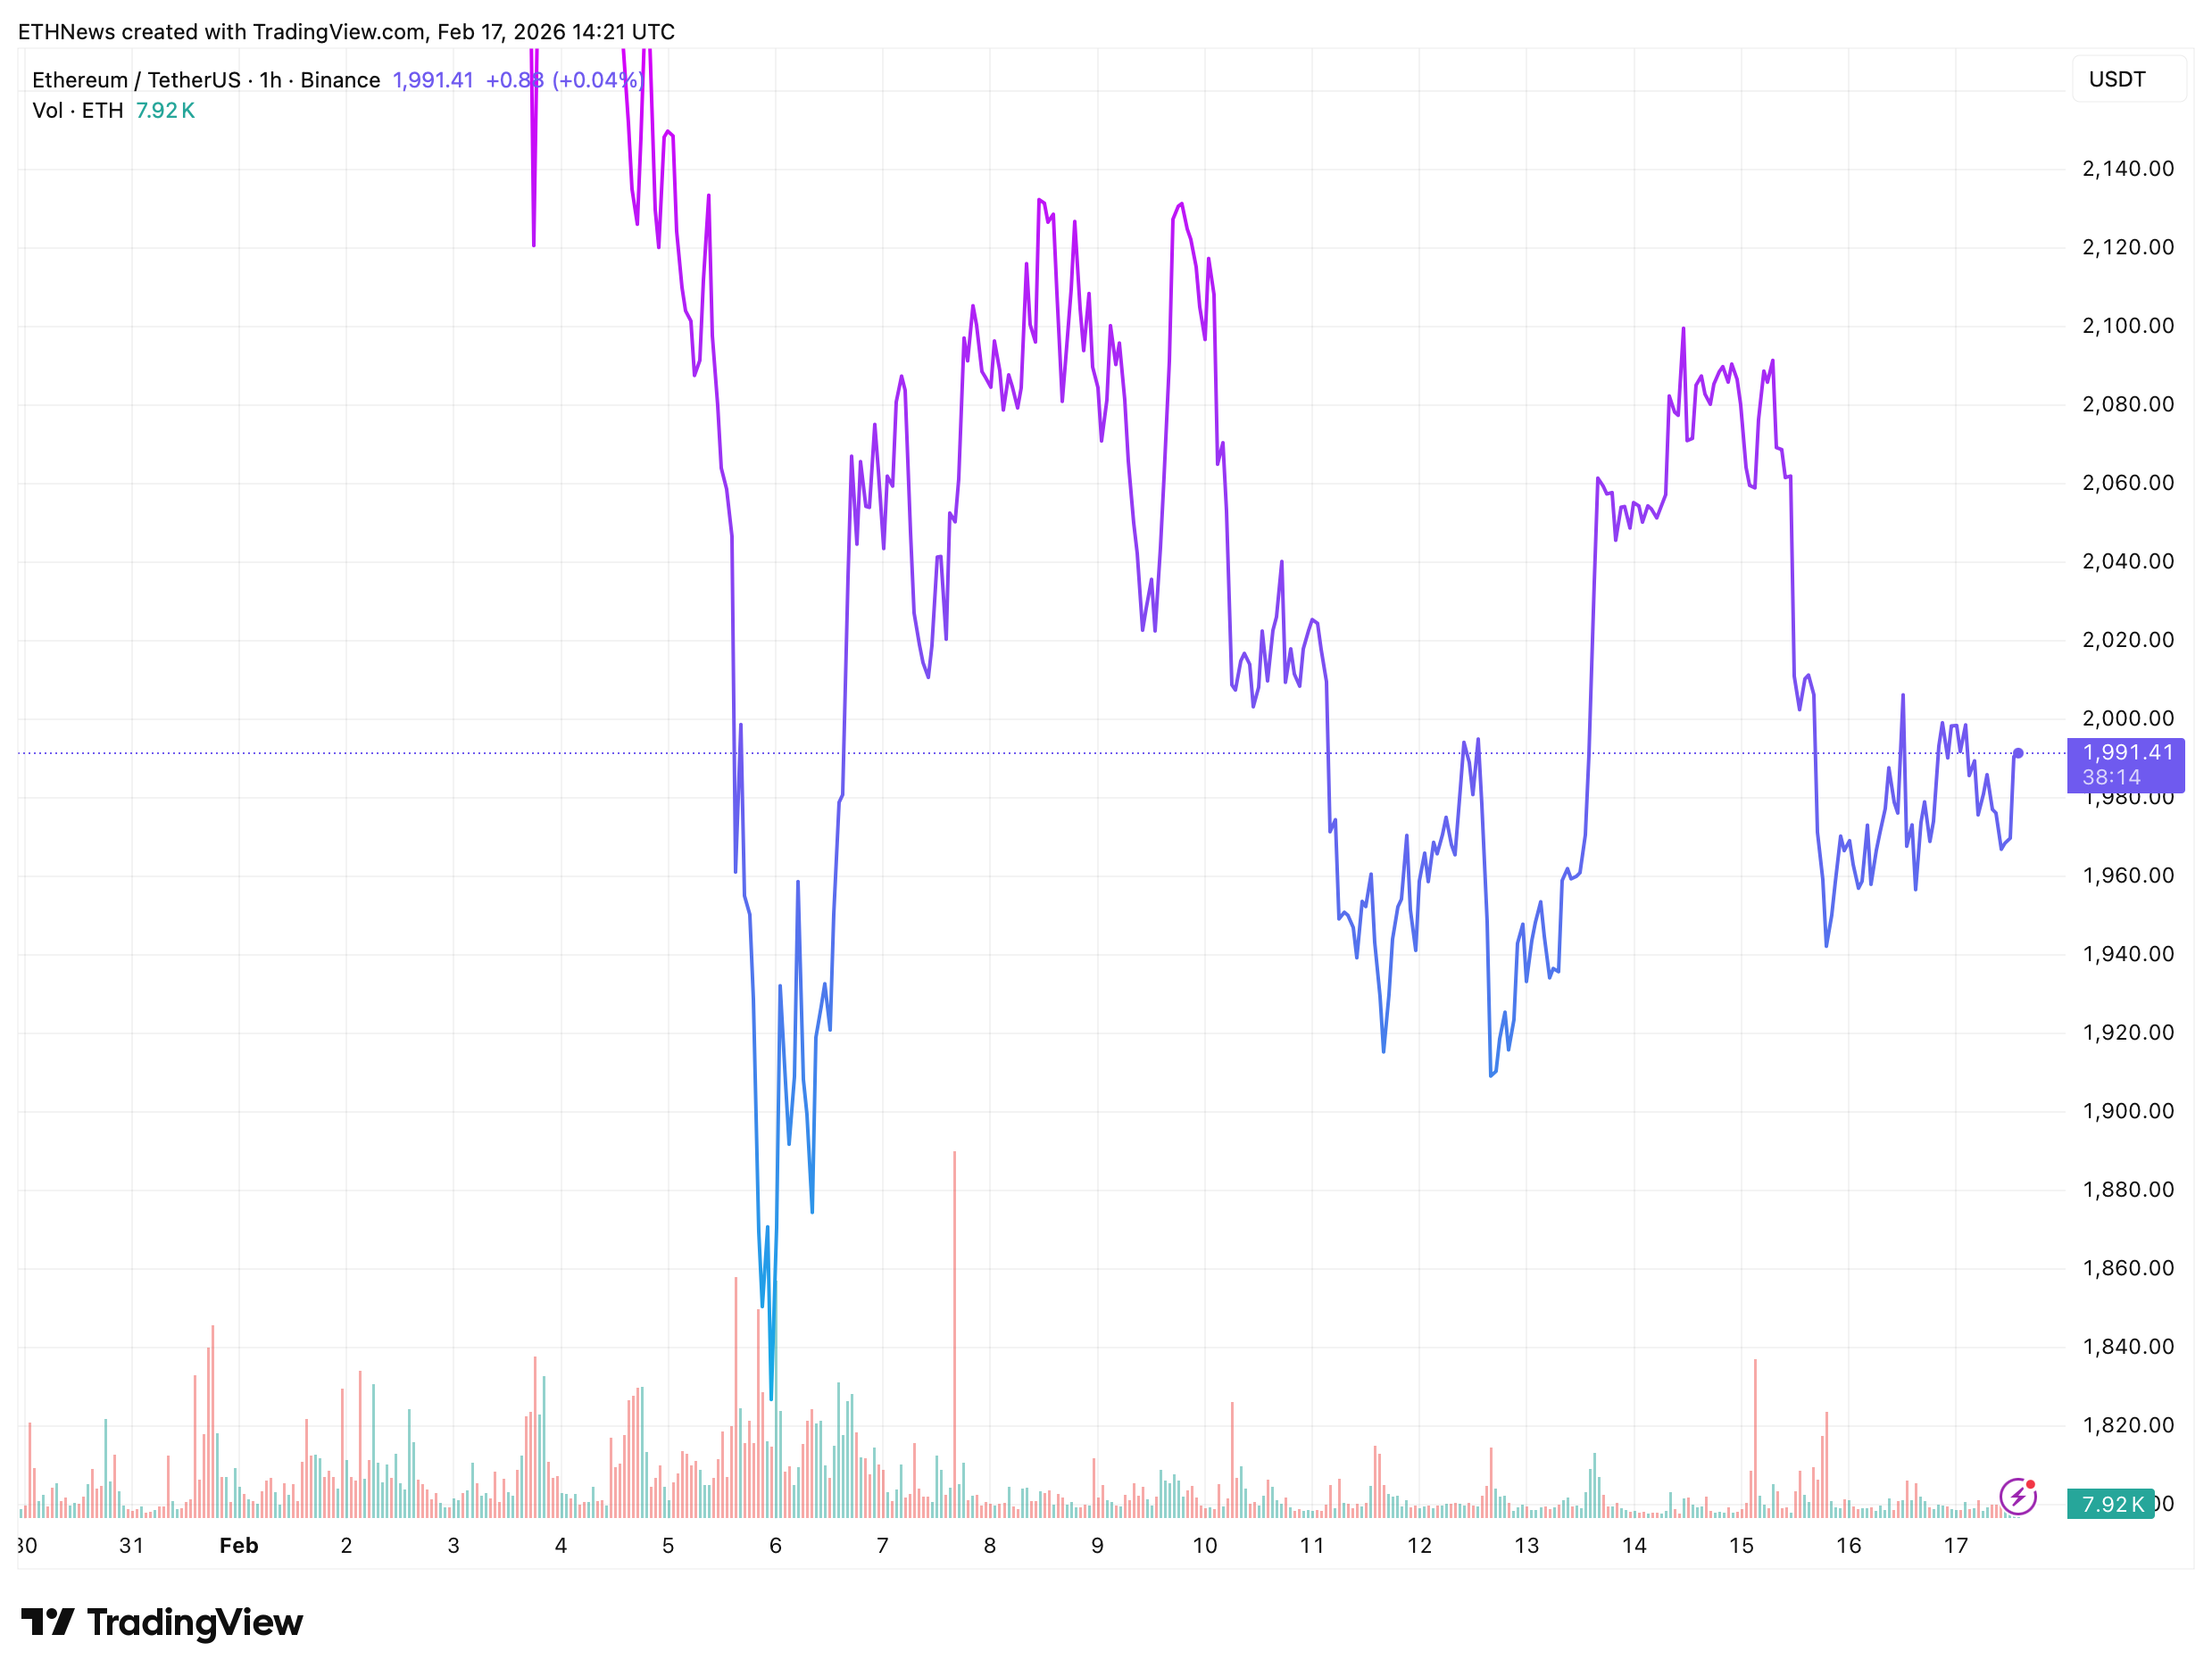
Volume has decreased compared to the initial selloff spike, suggesting that immediate panic pressure has cooled. However, there is no confirmed breakout structure yet. The market is compressing near support rather than impulsively reversing.
Key short-term levels visible on the chart:
- Immediate support: ~$1,950
- Local range resistance: ~$2,020
- Broader descending resistance (from GainMuse chart): above current range
A sustained push above the local range highs would be required to validate the rebound scenario illustrated in the analysis chart. Until then, price remains structurally capped beneath diagonal resistance.
What This Structure Suggests
Visually, the charts show a market that has reacted from support but has not yet reclaimed trend control. Ethereum is still trading inside a descending framework, and any recovery must break through well-defined diagonal resistance before the broader structure can shift.
Recovery attempts depend entirely on defending the current demand zone. Failure to hold it would likely expose the next lower liquidity pocket within the channel. For now, Ethereum sits at a technically important inflection point, supported, but not yet structurally reversed.


