


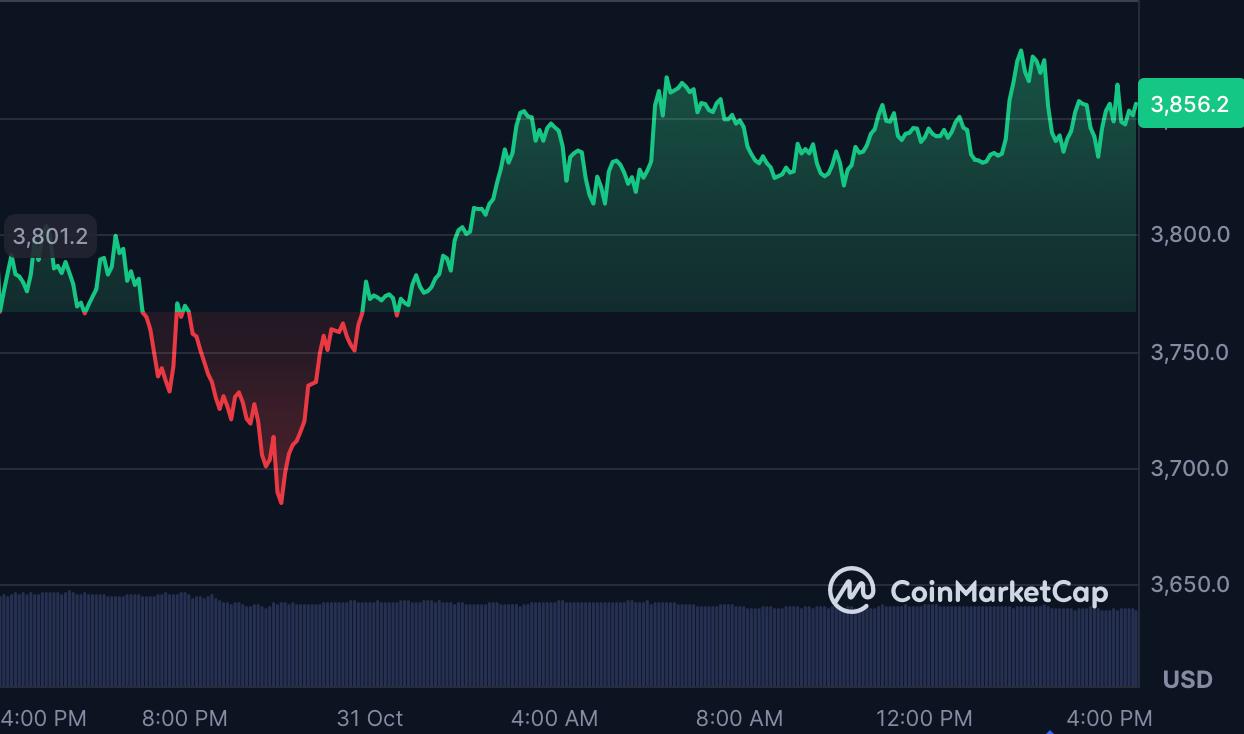
Ethereum is showing renewed momentum, climbing 2.16% in 24 hours to trade at $3,857, according to CoinMarketCap data. The world’s second-largest cryptocurrency now boasts a $465.6 billion market cap, with daily trading volume topping $37.6 billion despite a minor pullback from yesterday’s surge.
After briefly dipping to $3,700, Ethereum has rebounded strongly, with market analysts pointing to the same consolidation and breakout structure that preceded its explosive rally in 2020–2021.
“ETH Is Repeating 2020” – Chartists See $20K Potential
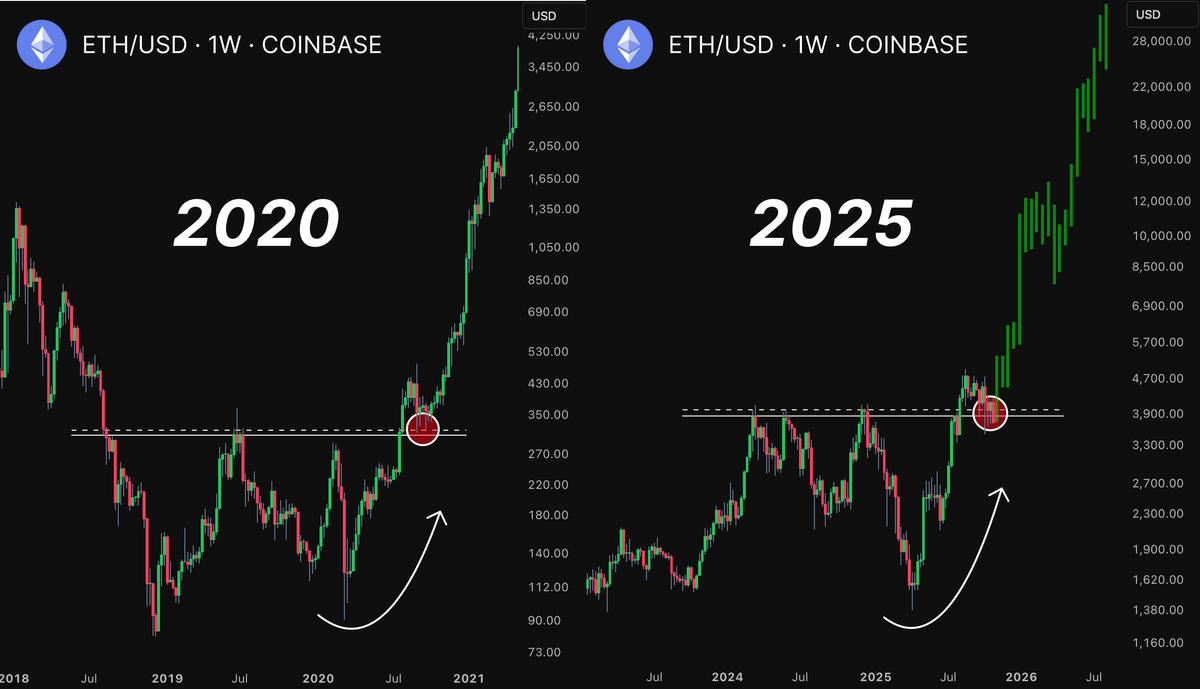
Prominent trader Ardizor shared a weekly chart comparing Ethereum’s current setup to its 2020 cycle. Both patterns show a retest of horizontal resistance before a powerful breakout. “Same retest, same structure,” he wrote. “$8K is FUD, $20K is the real target.”
If the pattern holds, Ethereum could be entering the early stages of a multi-year bull leg, mirroring the last time ETH broke consolidation and rallied 10x into its all-time highs.
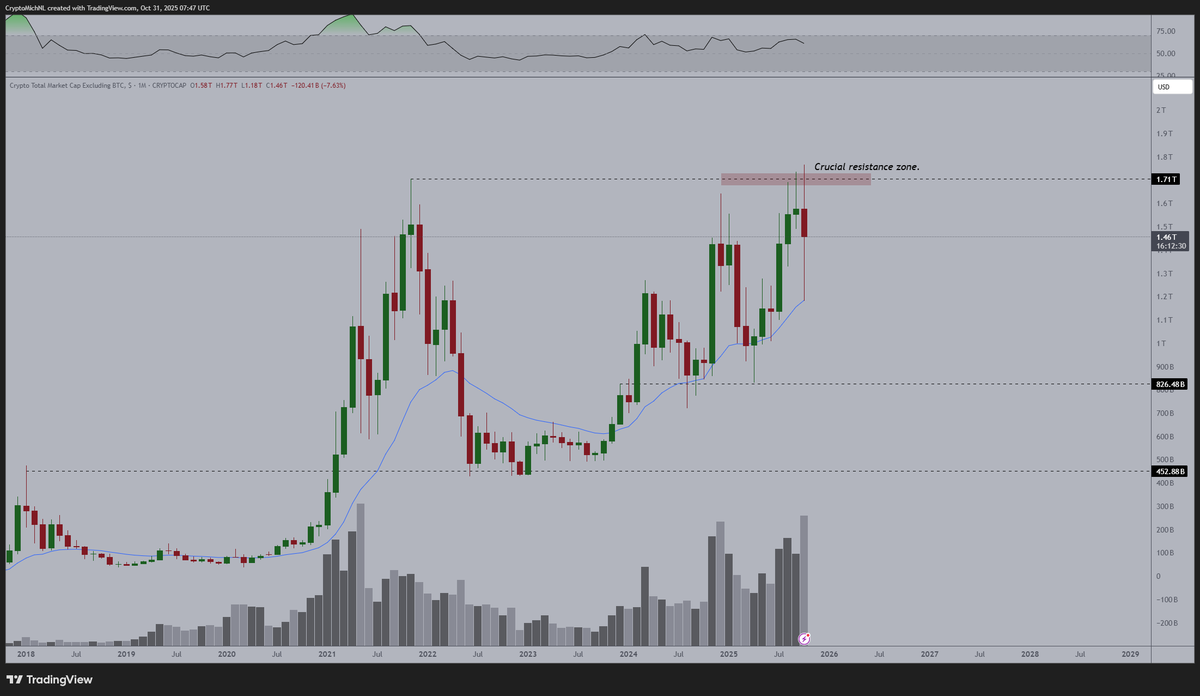
Supporting this view, Michaël van de Poppe highlighted a similar signal in the broader altcoin market capitalization, noting a massive bullish candle forming just below all-time highs. “The trend remains upward,” he said. “We’re facing the all-time high breakout soon, what follows could be the biggest bull run ever.”
Traders Turn Bearish, But History Suggests a Bounce
Despite the optimism from long-term analysts, on-chain sentiment tells a different short-term story. According to Santiment, Ethereum’s drop to $3.7K earlier this week triggered a spike in short positions across major exchanges, as traders bet against further upside.
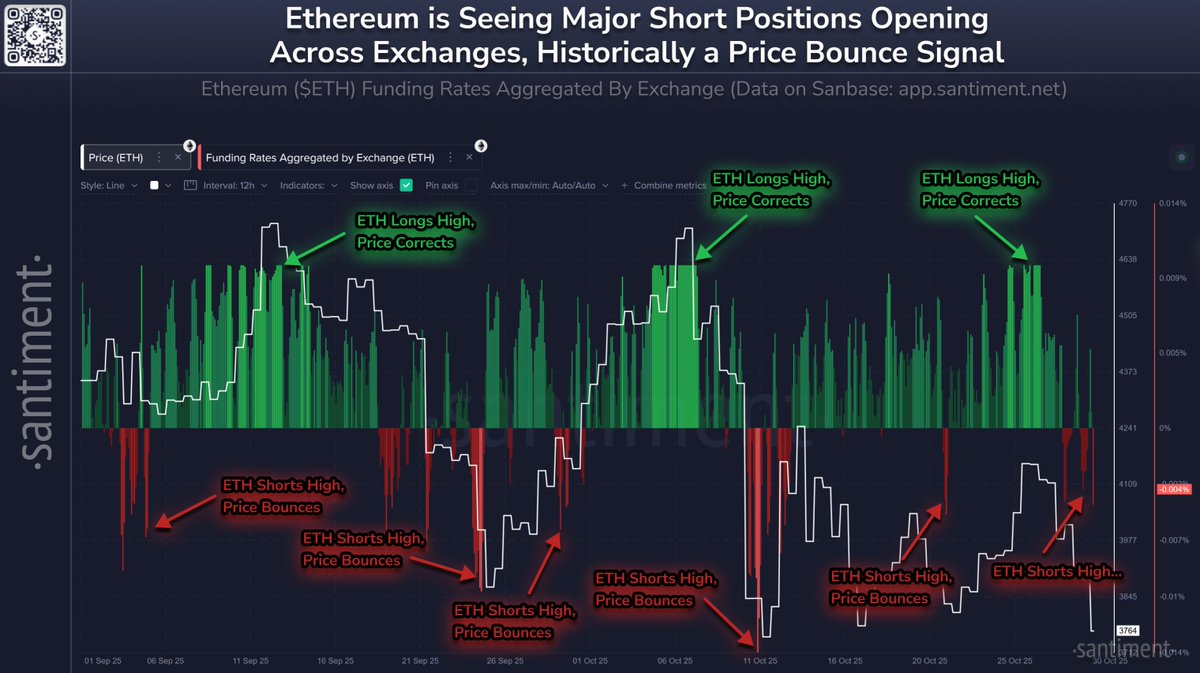
Historically, however, such conditions have often preceded sharp rebounds. Santiment’s data shows that when shorts dominate, as they do now, Ethereum tends to bounce, while overleveraged longs usually mark local tops.
This dynamic has played out multiple times since September, with ETH prices rebounding each time funding rates flipped heavily negative.
Technical Picture: Structure Mirrors 2020 Breakout
The current ETH/USD structure features the same retest of a long-held resistance zone around $3,800–$3,900, a level that capped Ethereum’s advances for much of 2024. On the weekly chart, the move resembles the 2020 breakout from the $350 level, which preceded Ethereum’s run to $4,200 the following year.
If this fractal continues, analysts argue, Ethereum’s next rally could aim toward the $8K psychological level in the short-to-medium term, with a longer-term potential toward $20,000 if macro and ETF tailwinds align in 2026.
The Road Ahead
For now, Ethereum’s resilience above $3,850 is a key signal. As short sellers crowd in and funding rates turn negative, the setup increasingly mirrors past “shakeout before breakout” patterns that defined early bull cycles.
In the words of van de Poppe, “The biggest bull run ever” may not be far off, and if Ardizor’s comparison holds true, Ethereum could once again turn skepticism into a historic upward explosion.


