


Ethereum has pushed back above the $3,100 level after posting solid gains over the past seven days, stabilizing following late-December weakness.
According to the latest TradingView data, ETH is trading near $3,134, marking a notable recovery from sub-$3,000 levels seen at the end of 2025.
The move places Ethereum back into a technically important price zone, with short-term structure improving while broader sentiment remains cautious.
Price Structure Improves on the 4H Chart
The 4-hour TradingView chart shows Ethereum establishing a clear higher-low structure since December 29. After consolidating below $3,000, price began trending higher into early January, eventually reclaiming the $3,100 area.
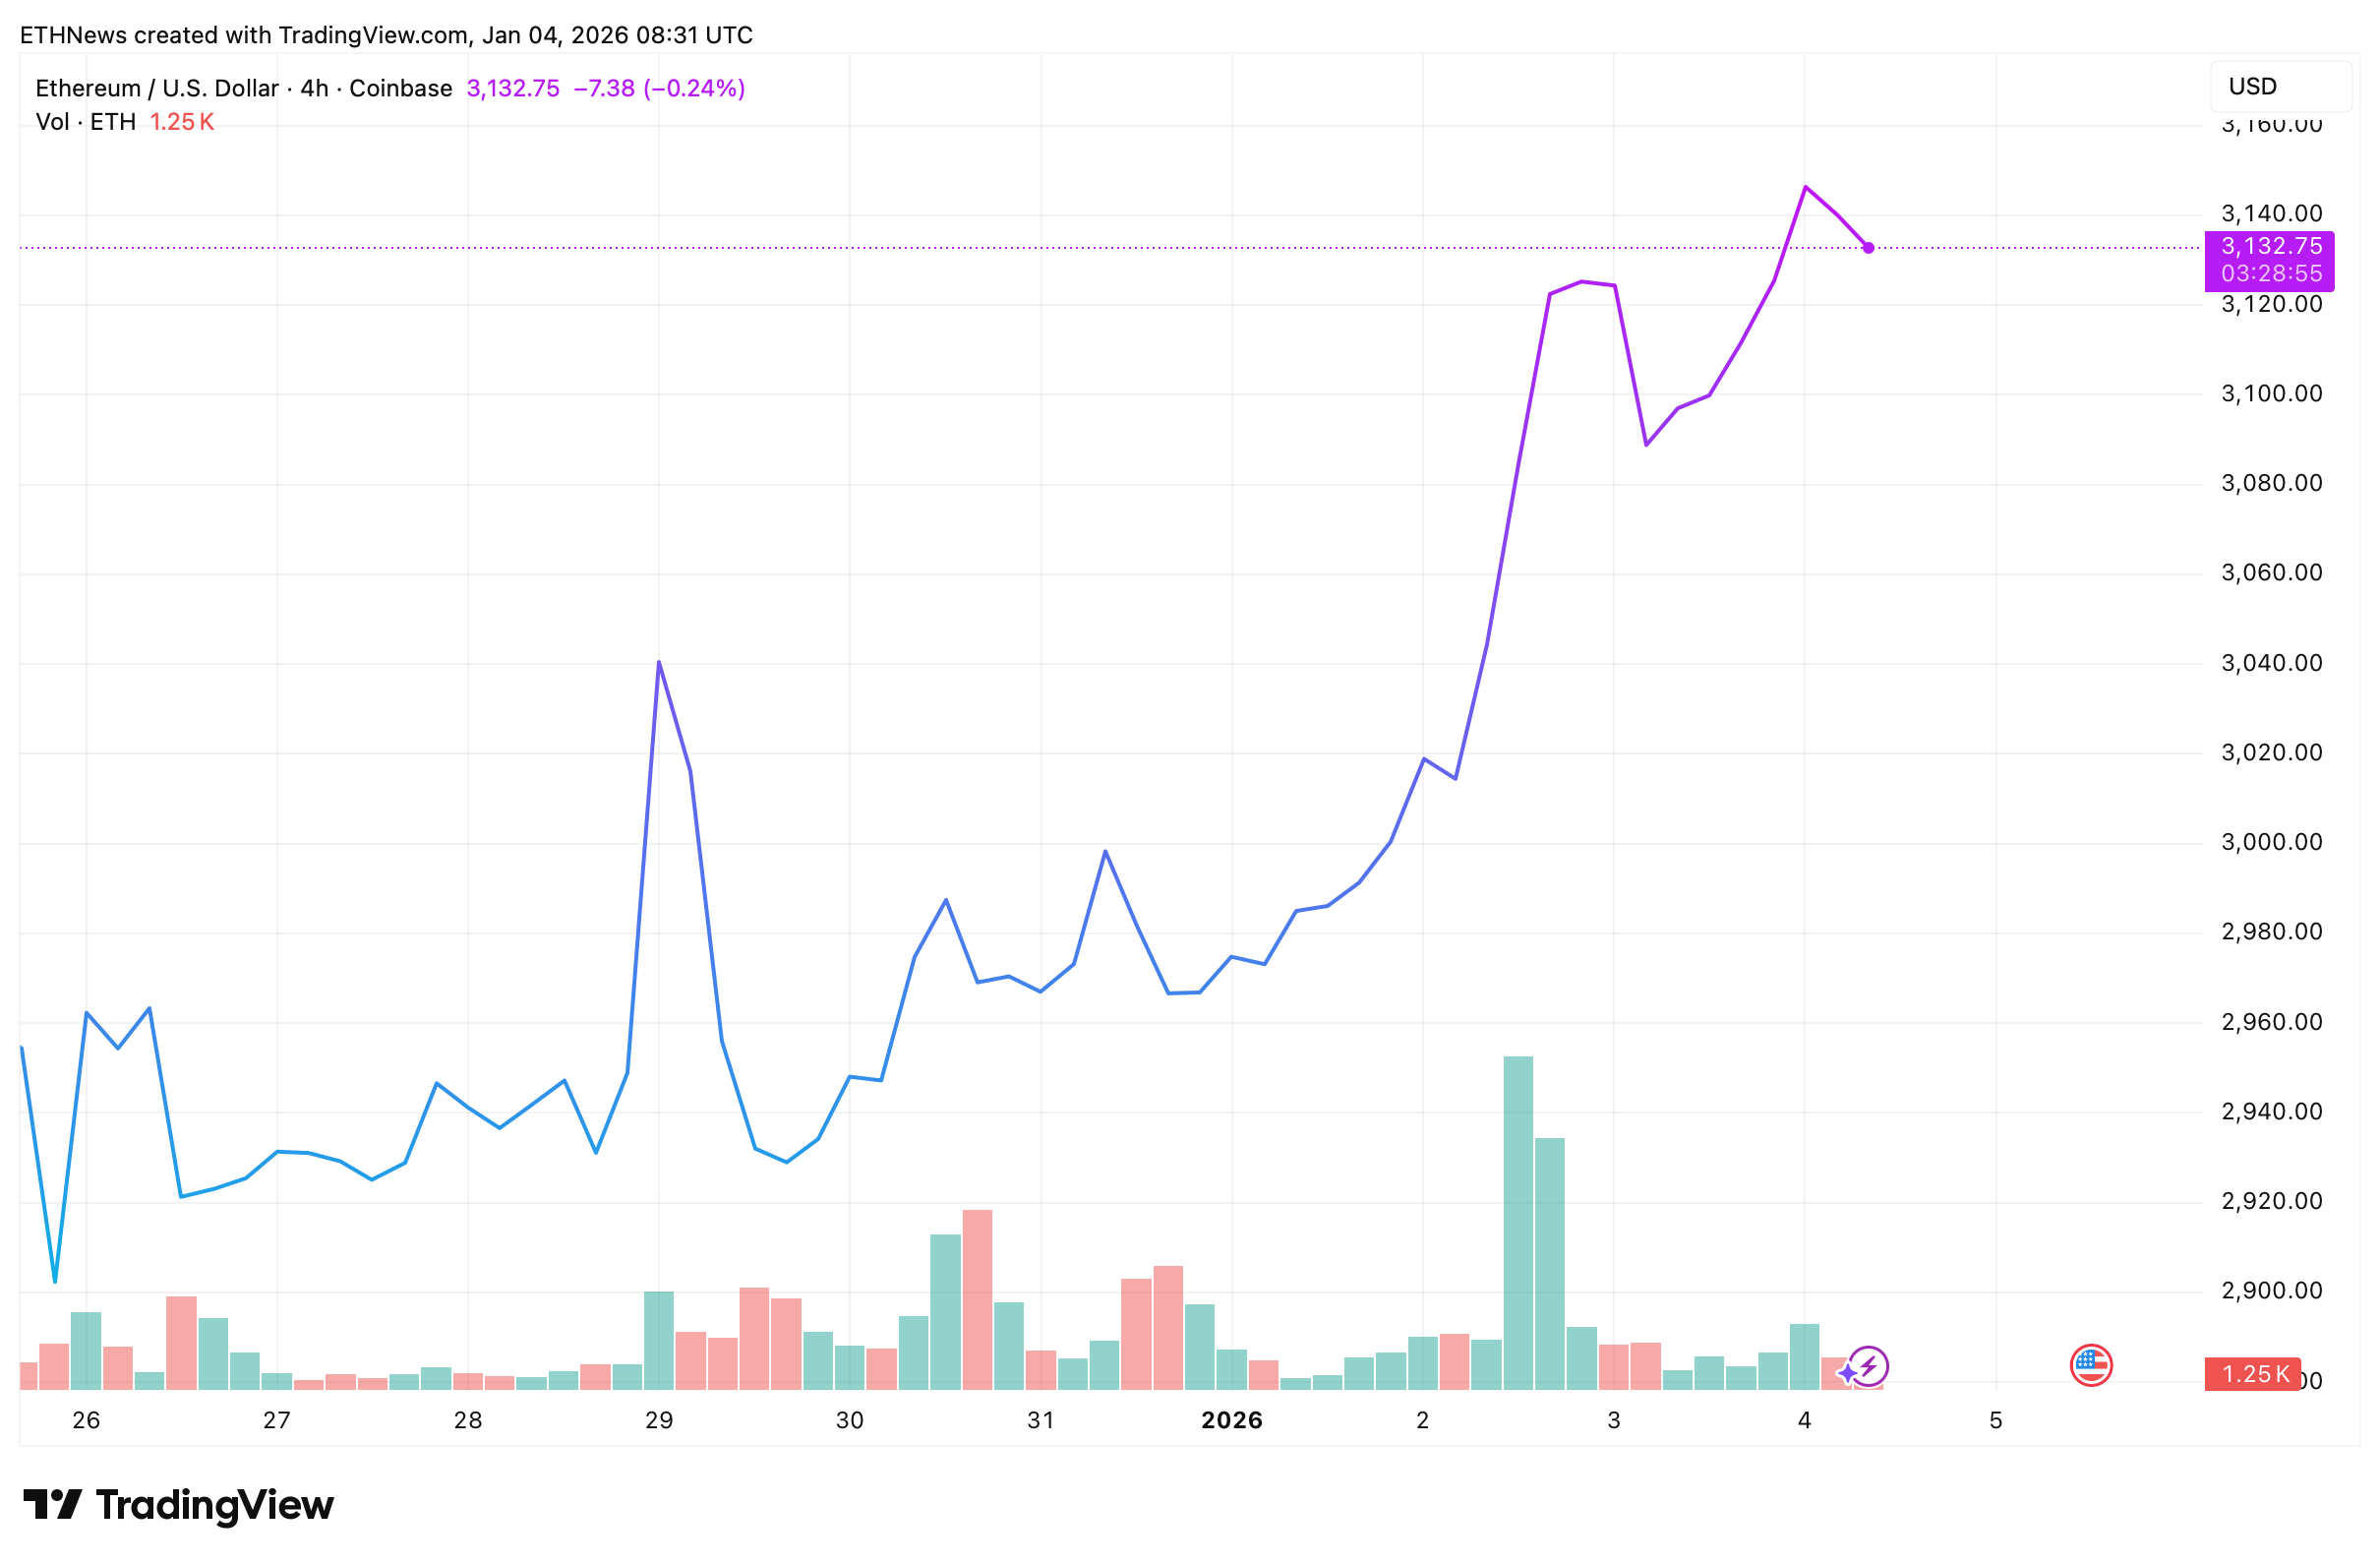
The rally was accompanied by visible increases in trading volume during the strongest upward impulses, suggesting active participation rather than a thin, low-liquidity bounce. Although price has pulled back slightly from the local high near $3,150, ETH continues to hold above former resistance.
Key Technical Levels to Watch
Based on the metrics shown in the chart:
- Current price: ~$3,134
- 50-day SMA: ~$2,980
- 200-day SMA: ~$3,322
- 14-day RSI: ~59 (neutral)
Ethereum is now trading above its 50-day moving average, which often acts as an important short-term trend reference. However, the 200-day SMA around $3,320 remains a major overhead level that could limit upside unless decisively reclaimed.
RSI sitting near neutral suggests price is not overheated, leaving room for continuation without immediate exhaustion signals.
Volatility and Sentiment Backdrop
Volatility is measured at 3.52% (medium), reflecting controlled price movement rather than disorderly swings. Despite the recent rebound, overall sentiment remains bearish, with the Fear & Greed Index reading 25 (Extreme Fear).
This contrast, improving price action during elevated fear, typically appears during recovery phases rather than at market peaks.
Short-Term Scenarios
As long as Ethereum holds above the $3,050–$3,080 support zone, the structure favors continued consolidation or further attempts toward the $3,300–$3,350 region, where the 200-day SMA sits.
A break below $3,000 would weaken the setup and shift focus back toward the 50-day SMA near $2,980. For now, the charts suggest Ethereum has reclaimed a key price level, with buyers defending higher ground while the market remains cautious overall.


