


Ethereum is approaching a decisive moment, according to several top traders who see mounting similarities between ETH’s current chart structure and Bitcoin’s pre-breakout patterns from earlier this year.
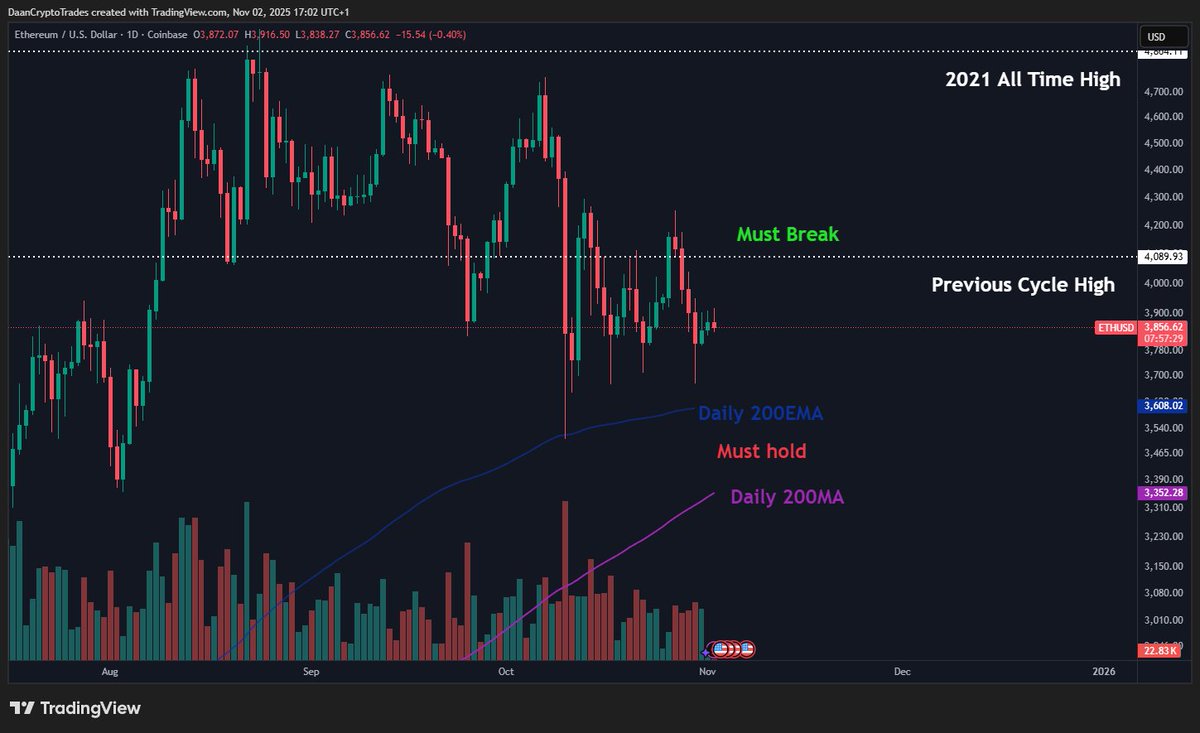
Analyst Daan Crypto Trades noted that Ethereum has been range-bound for weeks, with both local resistance and support repeatedly tested but unbroken. “Eventually, this will end in a big break and large volatility spike,” he said, pointing to key levels between $3,500 and $4,100. The daily chart shows ETH holding its 200-day EMA as short-term support, a zone that must hold to maintain bullish momentum, while $4,089 stands out as the resistance level that needs to be flipped for a structural breakout.
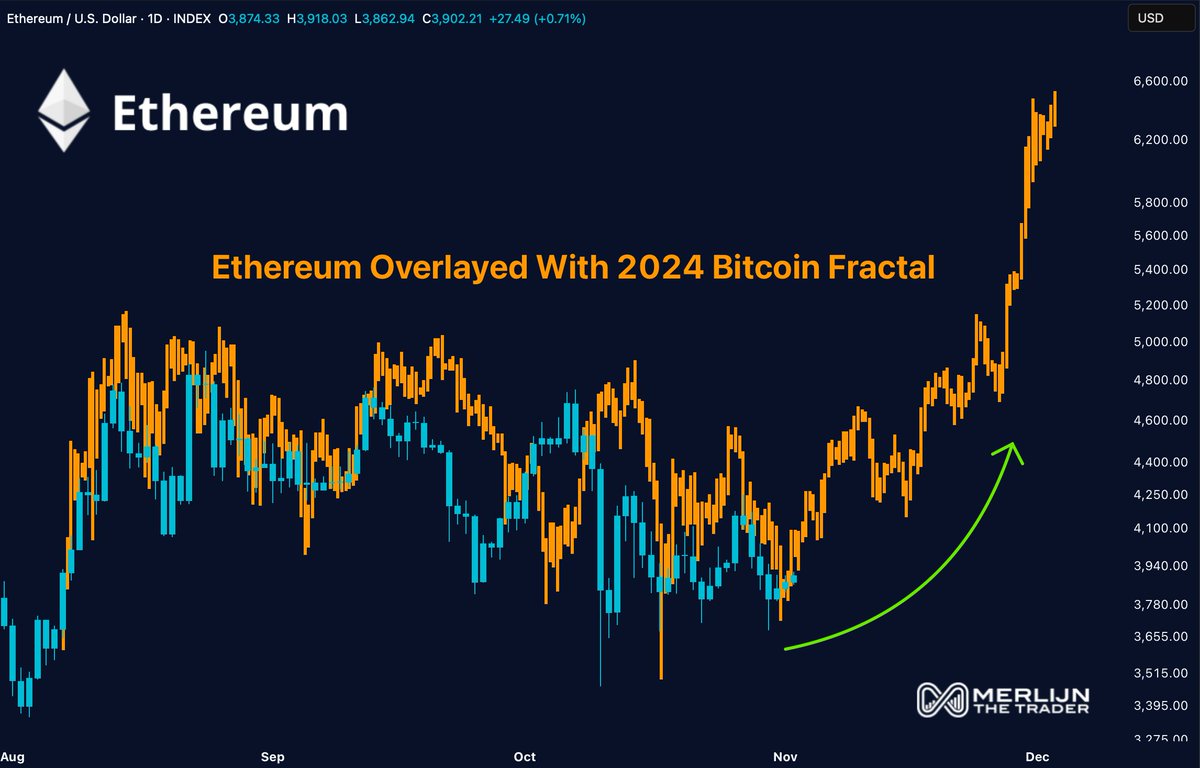
Adding to the bullish case, Merlijn The Trader overlaid Ethereum’s recent price movements with the 2024 Bitcoin fractal, revealing an almost identical rhythm and consolidation structure. “If the echo continues, $ETH is about to rip,” he stated, suggesting that Ethereum could be entering the same expansion phase Bitcoin experienced when liquidity began to return to the market. “Fractals don’t lie when liquidity returns. The setup is done, the move is next.”
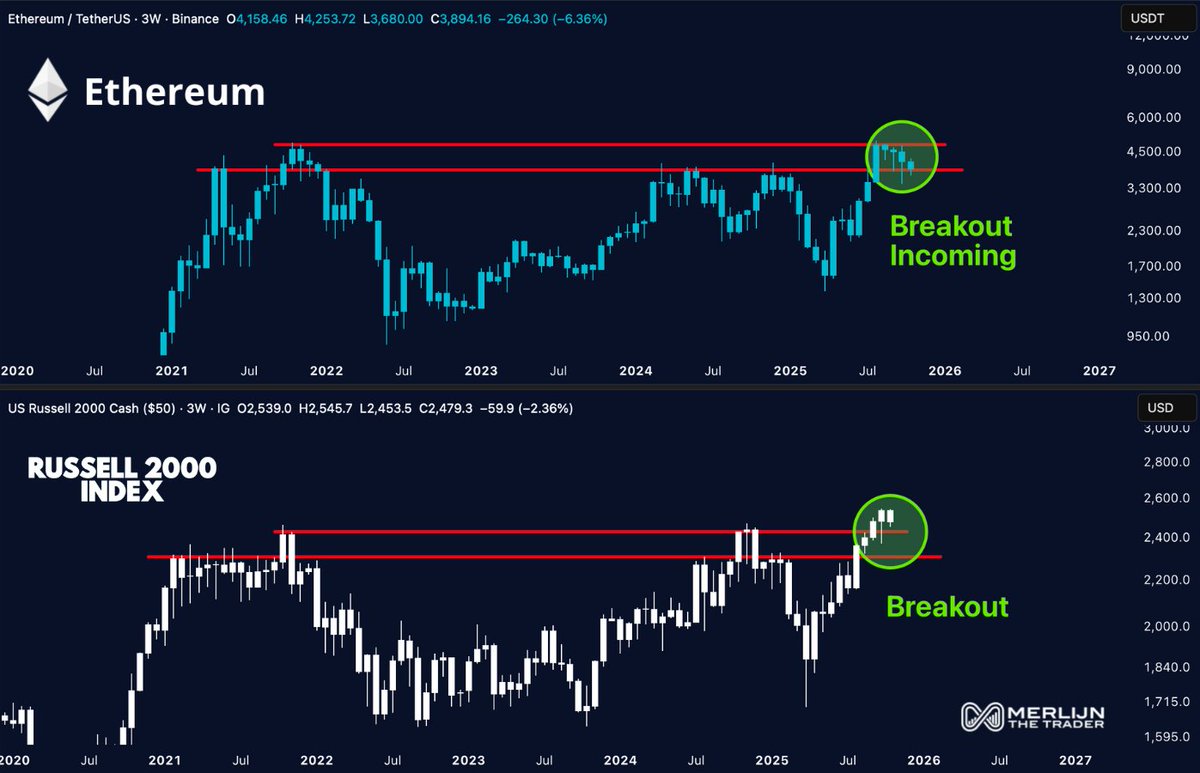
Merlijn also drew macro parallels between Ethereum and the Russell 2000 index, which recently broke out after three years of sideways trading.
“Stocks lead. Crypto follows,” he said, emphasizing that Ethereum is sitting just below the same resistance level that the Russell 2000 has already cleared. His chart labels this as a “front-running” opportunity, indicating Ethereum could soon follow equities higher.
With multiple confluences aligning, strong support at the 200EMA, macro equity breakouts, and fractal symmetry with Bitcoin’s 2024 run, analysts suggest that Ethereum may be nearing a critical inflection point. A clean breakout above $4,100 could trigger renewed volatility and potentially send ETH toward the $5,000–$6,000 zone, marking the next major phase in the cycle if market liquidity expands as expected.


