


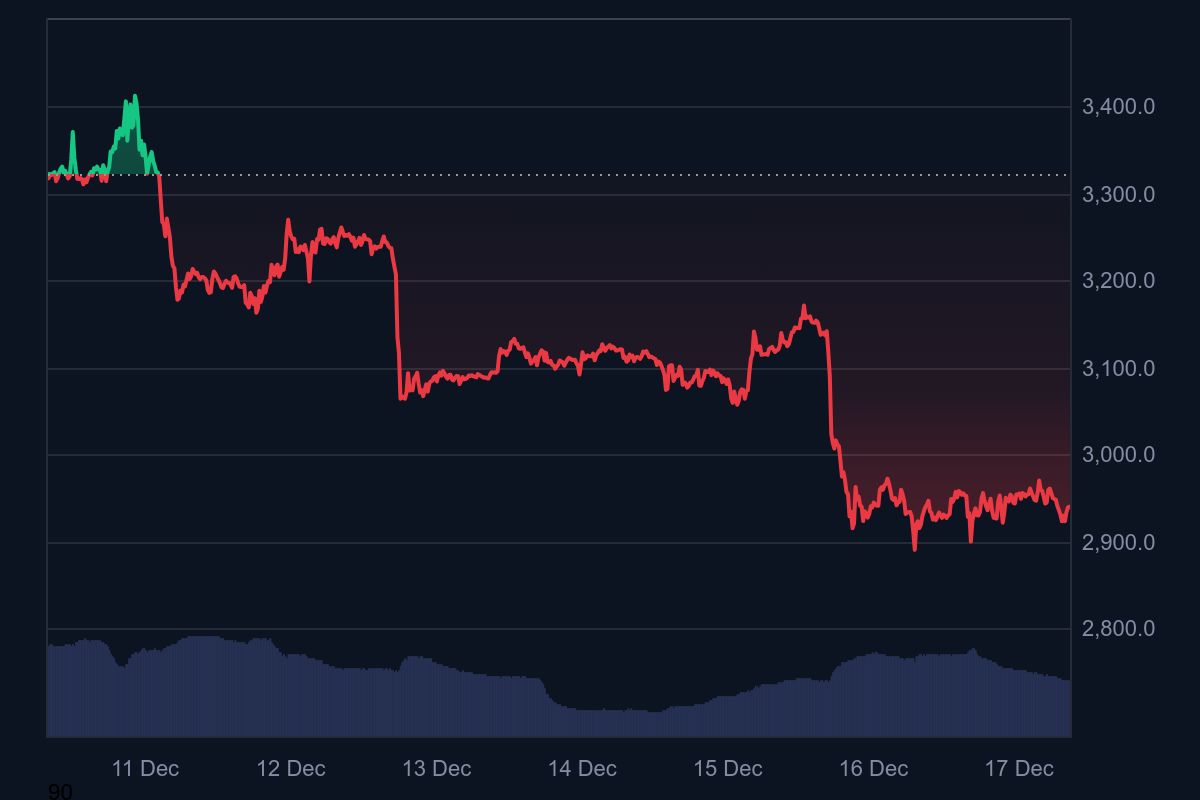
Ethereum has fallen sharply over the past week, slipping back below the $3,000 level after a sustained sell-off that erased roughly 11% of its value in seven days.
According to the latest data shown in the chart, ETH is currently trading around $2,940, marking a clear breakdown from higher price levels seen earlier in the month.
The price action highlights a decisive bearish shift. Ethereum attempted to stabilize above $3,200 earlier in the period but failed to hold that zone. A steep decline followed, pushing the price toward the $2,900 area, where it is now consolidating with continued volatility.
Technical indicators in the snapshot reinforce the cautious outlook. Market sentiment is labeled bearish, while the Fear & Greed Index sits at 16, signaling extreme fear among participants. This suggests risk appetite remains weak despite the recent pullback.
From a trend perspective, Ethereum is trading below both its 50-day and 200-day simple moving averages, which stand near $3,189 and $3,393 respectively. Remaining under these long-term averages typically reflects sustained downside pressure and limits the strength of short-term rebounds.
Momentum indicators are mixed but subdued. The 14-day RSI is around 42.7, placing it in neutral territory, while volatility is measured at 4.55%, described as medium. Over the past 30 days, Ethereum has recorded 15 green days, indicating choppy conditions rather than a clear recovery trend.
Despite the recent weakness, the displayed price prediction points to a potential rebound toward $3,290, implying an upside of about 11.6% from current levels. However, with sentiment deeply negative and price still trending below key resistance levels, any recovery attempt may face significant hurdles unless broader conditions improve.
For now, Ethereum remains under pressure, with the charts showing sellers firmly in control as the market digests the latest downturn.


