


Ethereum’s network activity has entered a historically quiet phase. According to Glassnode data tracking total transaction fees (7-day moving average), Ethereum network fees have dropped to their lowest level since May 2017, marking a sharp contrast to previous market cycles.
The chart shows that while Ethereum’s price (black line) remains elevated relative to earlier years, total fees paid on the network (blue area) have steadily compressed and are now near the bottom of the historical range. This divergence highlights a significant shift in how the network is being used.
A Long-Term View of Fee Cycles
From 2017 through early 2021, Ethereum transaction fees experienced multiple explosive spikes. These periods coincided with intense on-chain activity, reflected by sharp fee surges during major bull phases.
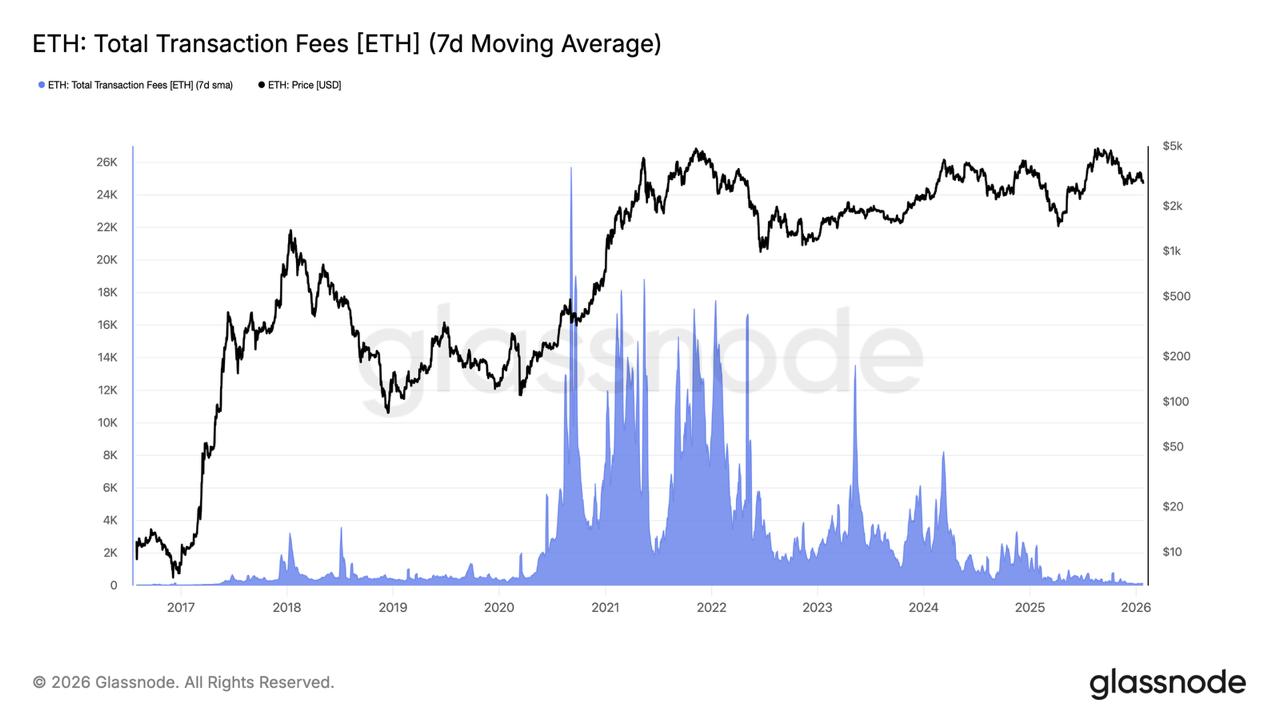
The most extreme fee environment occurred between 2020 and 2022, when sustained congestion pushed fees to record highs for extended periods.
Since that peak, the chart illustrates a persistent and structural decline in fees. Each subsequent rebound in price has been met with lower and shorter-lived fee spikes, indicating that transaction costs are no longer responding to price strength the way they did in earlier cycles.
By 2025–2026, the 7-day moving average of total fees has compressed to levels last observed before Ethereum’s first major adoption wave.
Decoupling Between Price and Network Costs
One of the most notable signals in the chart is the decoupling between Ethereum’s price and fee generation. Historically, rising prices tended to coincide with increased network congestion and higher transaction fees. In the current environment, price remains relatively high, yet fees continue to trend lower.
This suggests that network efficiency has improved, allowing activity to occur without driving congestion. It also indicates that speculative and high-intensity on-chain behavior, which historically pushed fees higher, is currently subdued.
What the Low Fee Environment Signals
At this level, Ethereum fees reflect a network operating under minimal stress, with ample block space and limited competition for inclusion. From a historical perspective, fee compression of this magnitude has typically occurred during early adoption phases or late-cycle cooling periods, rather than during peak speculative demand.
The chart does not show signs of renewed fee expansion yet. Until sustained fee growth reappears, the data suggests that on-chain demand remains muted, even as price action holds up.
Structural Shift in Ethereum Usage
The broader takeaway from the chart is that Ethereum has entered a new operational regime. Compared to earlier years, the network is capable of supporting usage without triggering the fee shocks that once defined bull markets.
Whether this represents a temporary lull or a lasting structural change will depend on future demand cycles. For now, the data clearly shows that Ethereum’s network fees are operating at levels not seen since its earliest growth phase.


