


- Dogecoin remains trapped beneath a persistent descending resistance line.
- The structure shows compressed lower-high rallies, signaling sustained bearish control.
- Another clean rejection could drag DOGE toward its next support confluence and projected target zone.
Dogecoin Faces Renewed Selling Pressure
Dogecoin is slipping again after reacting sharply to its trendline, reinforcing the broader downside pressure that has governed its behavior for weeks. The market’s reaction highlights a structure defined by weakening rebounds, fading momentum, and repeated failures to reclaim key upper levels. This pattern keeps sentiment fragile, especially as traders closely watch whether DOGE can avoid a deeper breakdown.
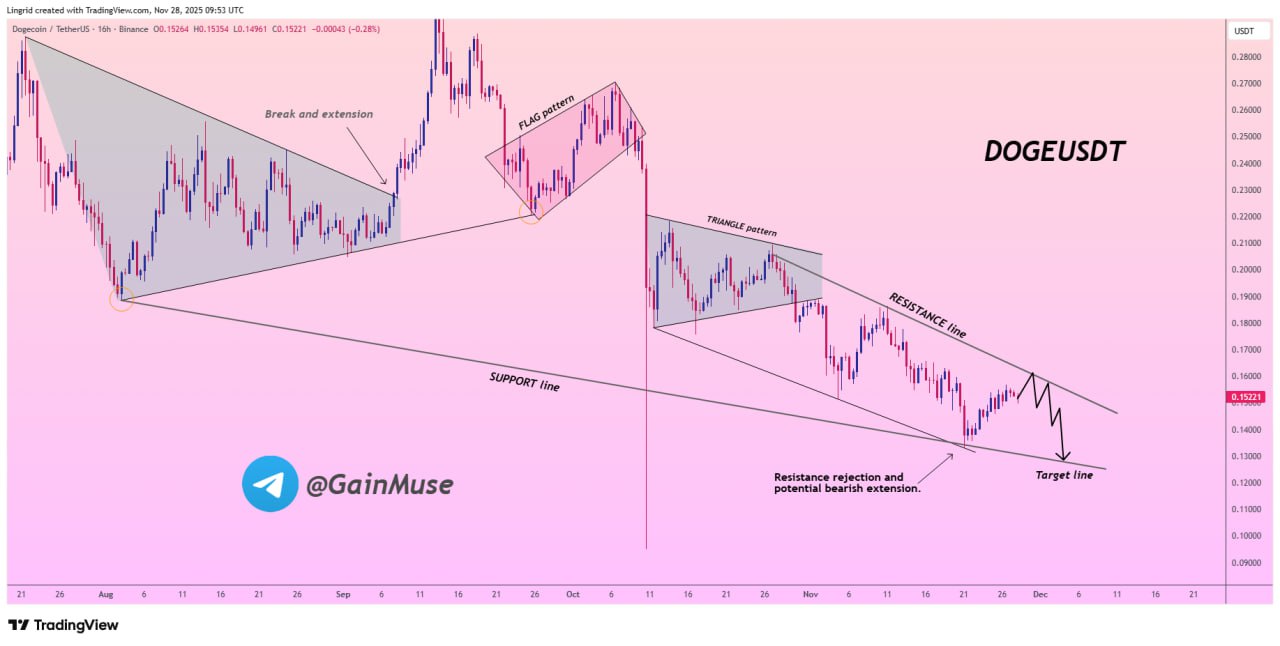
The chart from GainMuse outlines this clearly: every rally since mid-month has peaked lower, each one getting compressed more tightly against a declining resistance band. The price is also drifting below former support areas, confirming that sellers remain in firm control.
Technical Structure Points to Extended Bearish Continuation
According to the DOGEUSDT setup, Dogecoin remains capped beneath a well-defined descending resistance line. Each attempt to rally has been absorbed before reaching meaningful recovery zones. This repeated compression creates a sequence of lower highs that typically precedes continuation in the dominant trend, in this case, bearish.
A clean rejection at current levels would likely guide DOGE toward its next support confluence and the projected target line highlighted in the analysis. The structure suggests that unless bulls break resistance decisively, the path of least resistance remains to the downside.
Sentiment, Indicators, and Momentum Data
Market data reinforces the technical picture:
- Current Price: $0.1510
- 14-Day RSI: 42.84 (Neutral but skewing toward pressure)
- 50-Day SMA: $0.1788
- 200-Day SMA: $0.2075 (a wide gap that signals persistent trend deterioration)
- Volatility: 8.71% (High)
- Sentiment: Bearish
Only 40% of the last 30 days have been green, underscoring the difficulty DOGE has faced in establishing any stable upside traction. With price trading well below both major moving averages, trend momentum remains clearly negative.
Chart Breakdown: What TradingView Reveals
The TradingView chart shows a choppy but downward-leaning structure across the November 23–28 window. After a brief surge toward $0.1560, DOGE failed to stabilize at higher levels, slipping back toward the $0.1500–$0.1520 range.
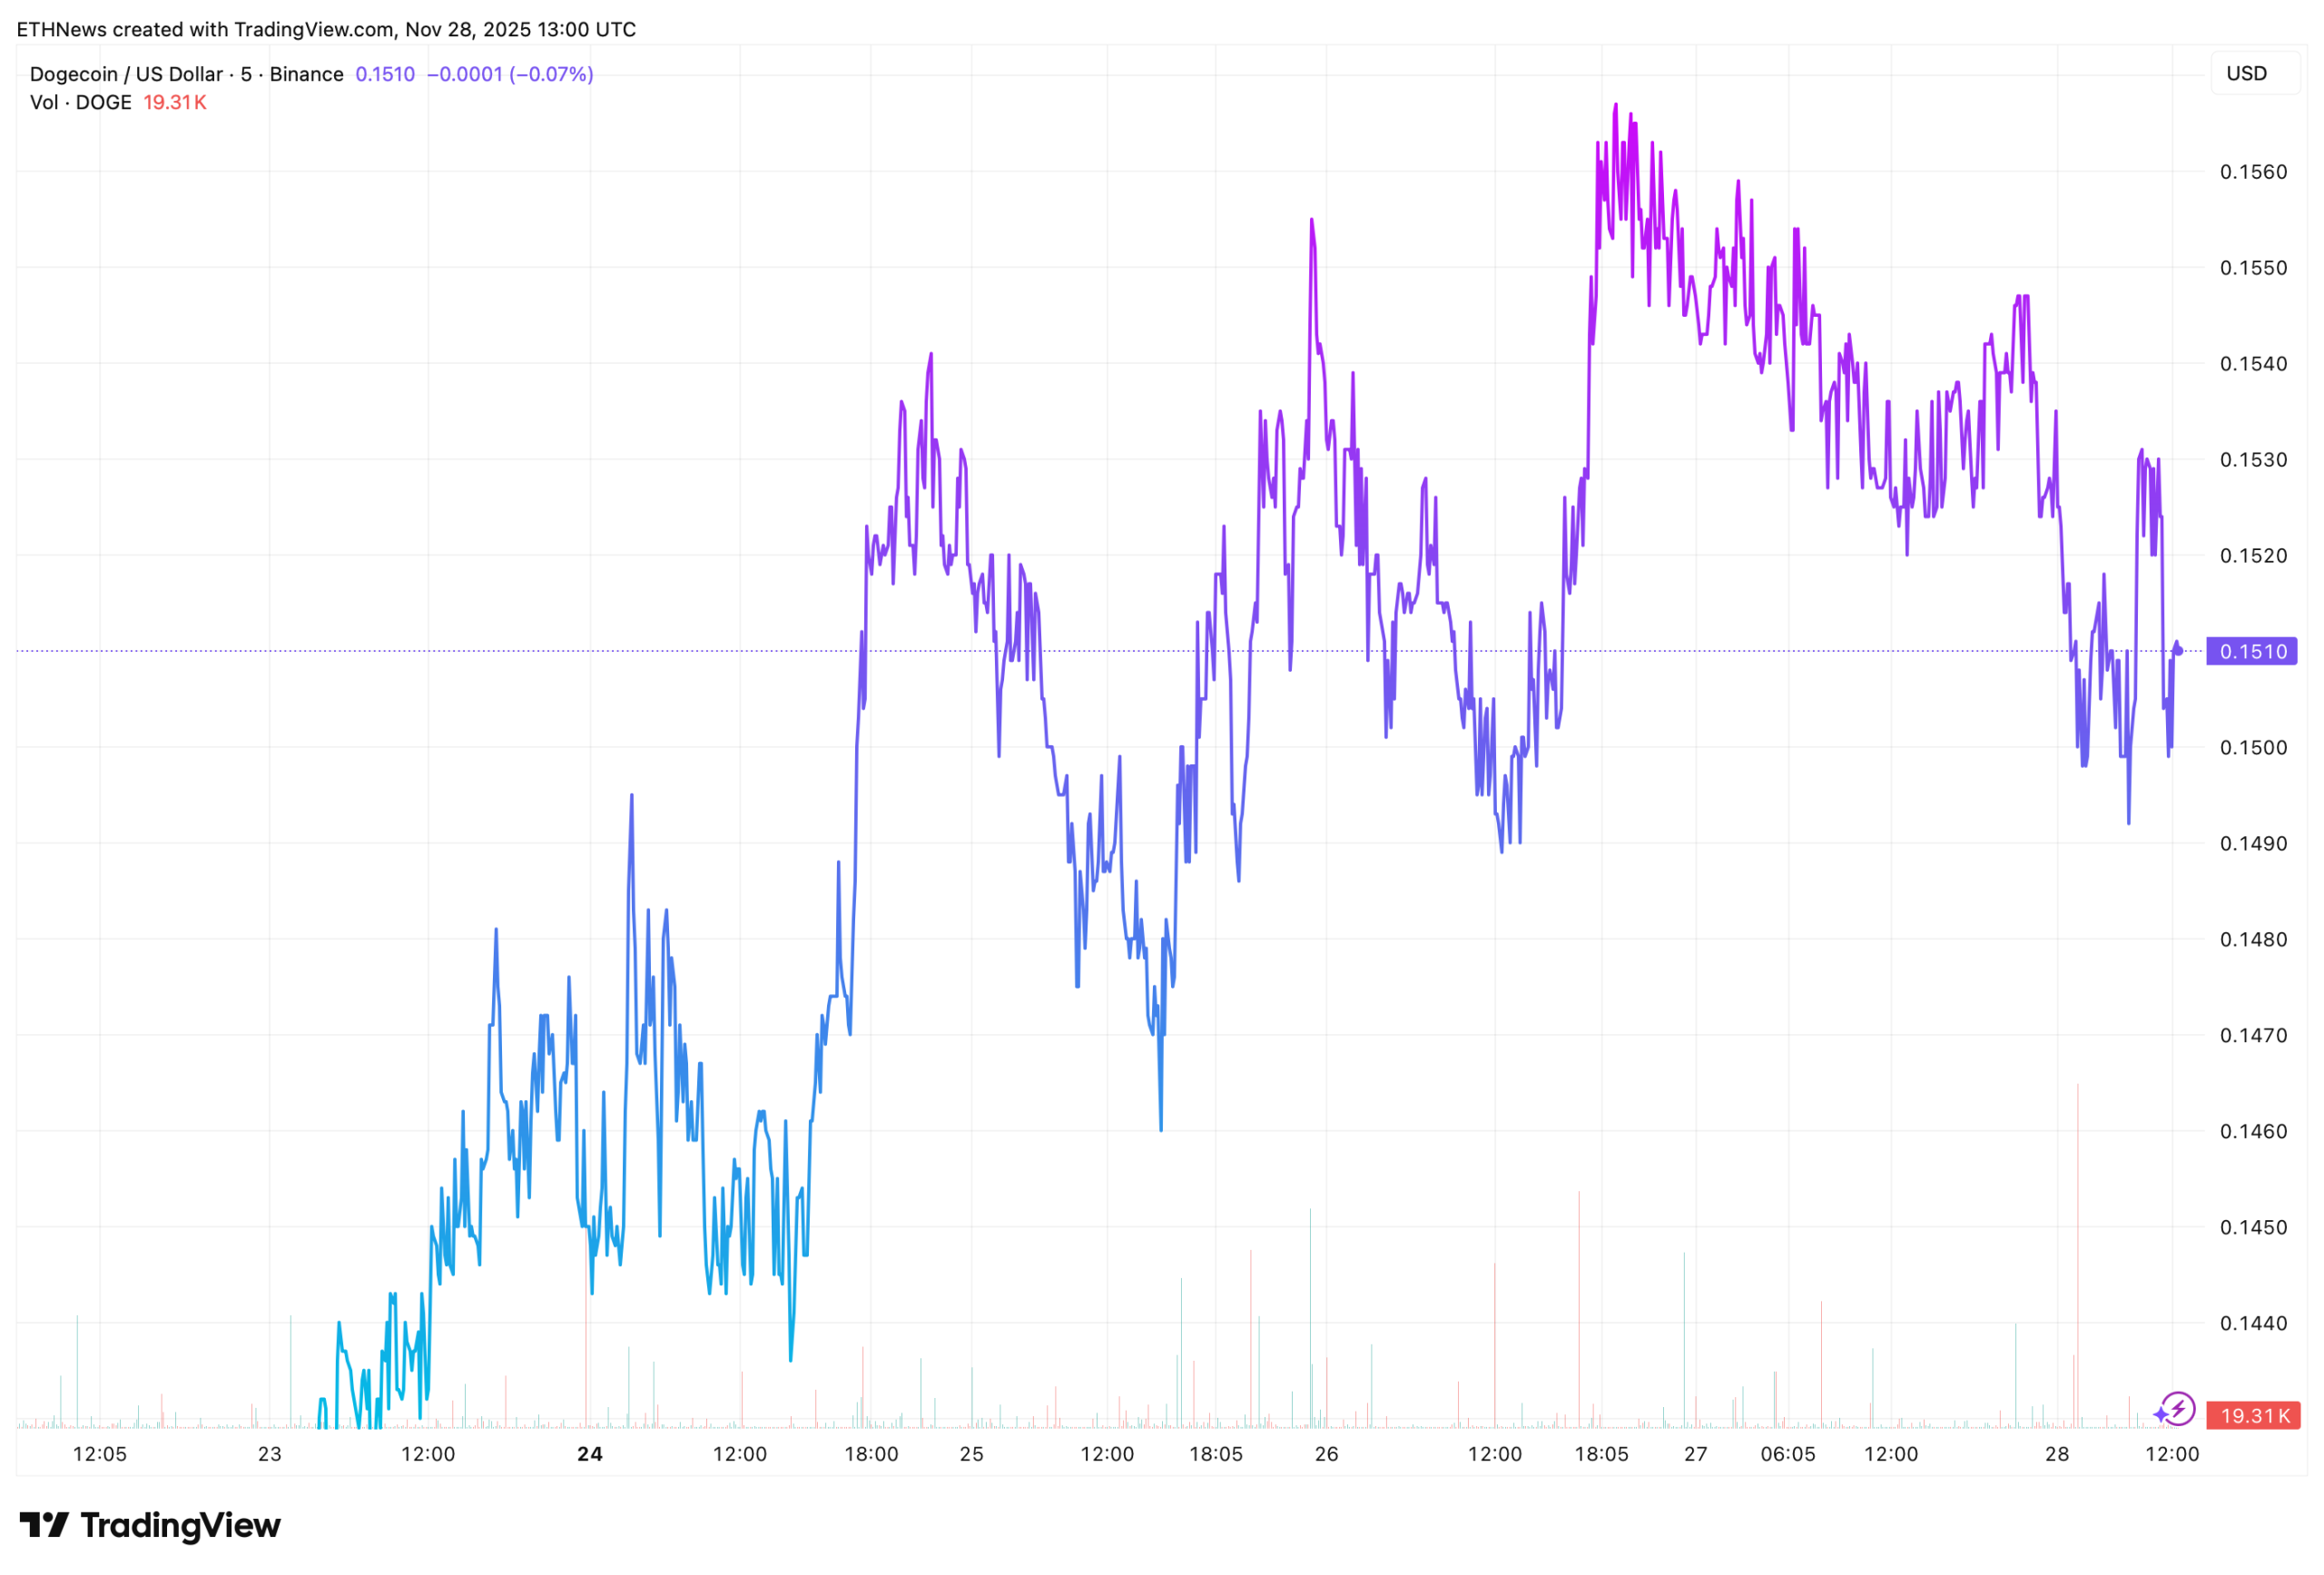
Volume spikes confirm that sellers are stepping in aggressively during each upward attempt. Meanwhile, stretched wicks near the highs illustrate how quickly rallies are being faded.
This behavior aligns with the broader pattern shown by the technical breakdown: DOGE is struggling to maintain upward momentum and continues to respond more strongly to resistance than to support.
What Traders Should Watch Next
The decisive level is the descending resistance line.
- A breakout above it would be the first sign of shift in control.
- Another clean rejection, as the structure currently implies, would reinforce the bearish continuation and could send DOGE toward its projected target zone.
With market sentiment stuck in extreme fear and compressed rallies continuing, Dogecoin remains vulnerable until buyers reclaim stronger territory.


