


Bitcoin’s price has regained ground, climbing 1.5% over the past 24 hours to trade above $115,000 on Friday. Onchain and technical indicators suggest that momentum is slowly returning to the market, though the $116,000–$121,000 resistance zone poses the next major hurdle for bulls.
Derivatives Take the Lead
Spot demand has remained weak in recent weeks, with softening ETF inflows limiting upside pressure. According to Glassnode’s latest Week Onchain report, the derivatives market has been setting the tone instead.
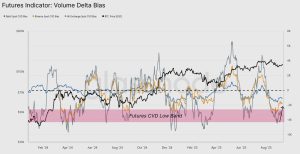
The firm noted that Bitcoin’s volume delta bias, a metric that gauges the balance between buying and selling pressure, recovered during the rebound from $108,000. This suggests seller exhaustion and points to futures traders absorbing recent sell pressure on major exchanges like Binance and Bybit.
Meanwhile, Bitcoin options open interest (OI) has surged to an all-time high of $54.6 billion, up 26% from the beginning of September. Options activity is leaning bullish, with calls outweighing puts, signaling growing investor confidence even as traders hedge downside risk.
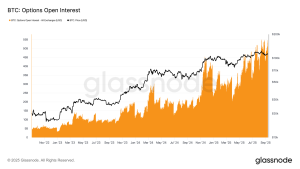
Historically, spikes in OI have coincided with Bitcoin’s push to fresh highs, such as August’s rally above $124,500.
“Both futures basis and options positioning reflect a more balanced structure than in past overheated phases, pointing to a market advancing on firmer footing,” Glassnode said.
Key Price Levels in Play
At press time, Bitcoin was changing hands at around $115,400, just shy of the $116,000 ceiling. For the recovery to hold, BTC must maintain support above $115,000, with bulls eyeing the next target at $120,000 if momentum carries through.
However, bears are expected to fiercely defend the $116,000–$121,000 supply zone, where significant resistance lies. On the downside, immediate support sits around $114,500 at the 50-day simple moving average (SMA), with deeper cushions at $112,200 (100-day SMA) and the psychological $110,000 mark.
Popular trader KillaXBT flagged $115,700—the August monthly open—as a critical pivot point. “This is a crucial pivot in terms of trend direction. We could see some deviation above, as always,” the analyst noted.
Liquidation Heatmap Signals Potential Breakout
Data from CoinGlass highlights significant liquidity clusters between $116,400 and $117,000. If Bitcoin manages to break through this zone, it could trigger a short squeeze, forcing bearish traders to exit positions and potentially driving the price closer to $120,000.
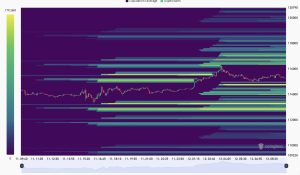
On the flip side, heavy bid orders sit at $114,700, with another cluster between $113,500 and $112,000, offering layers of support should selling pressure reemerge.
With derivatives activity hitting record highs and sellers showing signs of exhaustion, Bitcoin’s recovery is advancing on more solid footing. Still, the $116,000–$121,000 resistance band remains a formidable challenge. If bulls can clear this hurdle, a path toward $120,000—and potentially new all-time highs—could soon open up.


