


New report has sparked fresh market excitement after highlighting a historically bullish signal forming on Bitcoin’s chart: a 50-day moving average (50MA) slipping below the 200-day moving average (200MA), a pattern known as a death cross, but one that has repeatedly triggered major upside for BTC in past cycles.
Unlike traditional markets, where a death cross is seen as bearish, Bitcoin has shown the opposite behavior during recent cycles. Each time the short-term MA dipped under the long-term MA, BTC entered a powerful rally that ultimately led to new all-time highs.
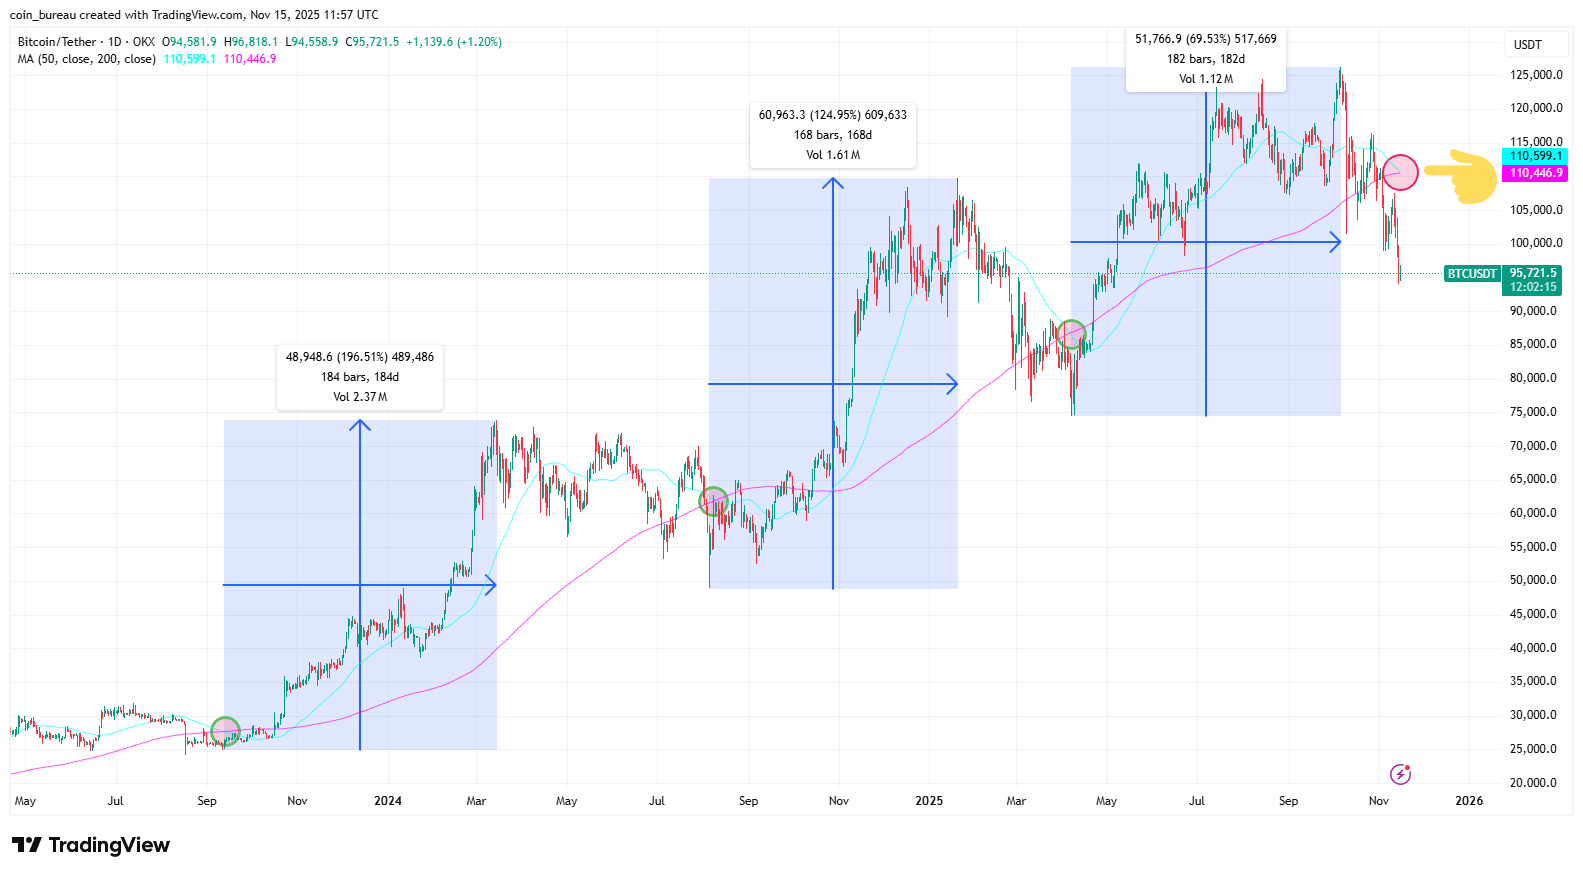
According to Coin Bureau, the last three occurrences delivered substantial gains:
- September 2023: +195%
- August 2024: +125%
- April 2025: +70%
The trend shows diminishing returns each cycle, but the pattern has remained consistently bullish. Based on that trajectory, a more modest 35% rally from current levels would place Bitcoin near $130,000 by May 2026, aligning with expectations for a continued post-halving uptrend.
The accompanying TradingView chart highlights how each prior cross preceded multi-month expansions, usually accelerated by improving liquidity, ETF inflows, and cycle-driven retail participation.
With Bitcoin hovering near key long-term support zones, analysts are watching this developing cross closely. If history rhymes, a new rally phase could already be forming beneath the surface.


