


Bitcoin traders are watching the charts closely after President Donald Trump officially ended the U.S. government shutdown, because the last time this political event unfolded, Bitcoin didn’t just rise… it went parabolic.
A viral chart shared today highlights how Bitcoin reacted in early 2019 when a similar shutdown ended under President Trump. On January 25, 2019, the government reopened after weeks of gridlock. What followed surprised even seasoned market observers: Bitcoin launched into a powerful multi-month rally that delivered gains of more than 300%, climbing from roughly $3,400 to over $13,000 by June.
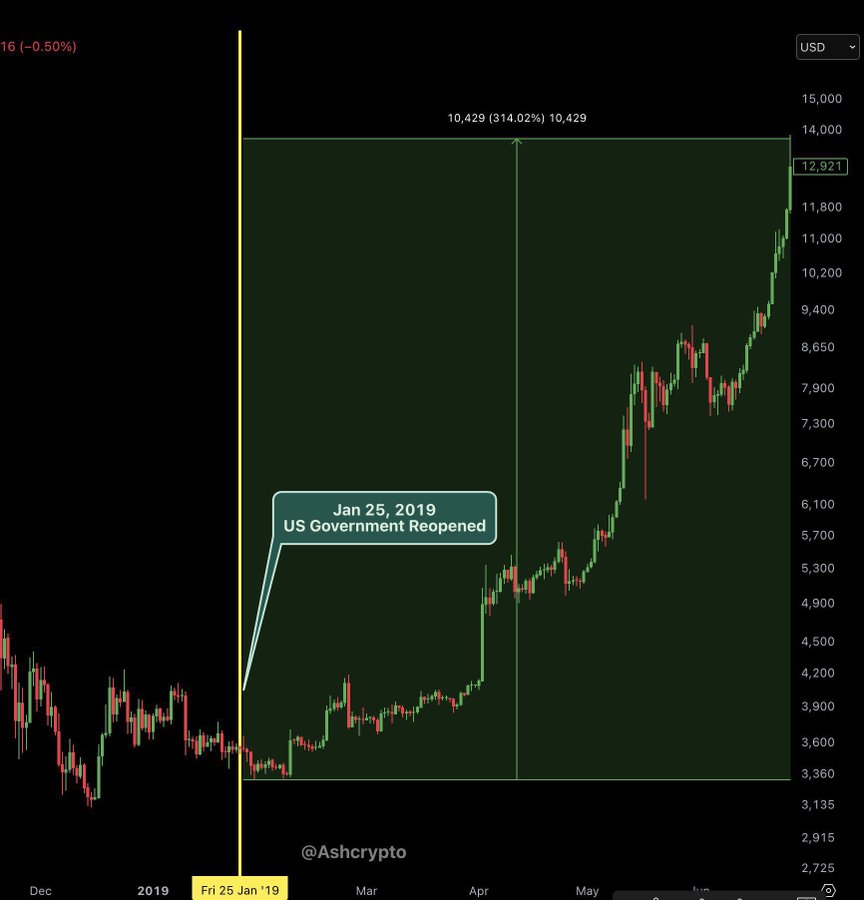
The chart shows a clean vertical expansion in price, marking one of Bitcoin’s strongest recoveries of that cycle. While the shutdown itself wasn’t the only catalyst, its end coincided with a macro shift in risk appetite, improving liquidity conditions, and renewed optimism across high-beta assets, all of which fueled Bitcoin’s explosive uptrend.
Today’s environment is different in many ways: Bitcoin trades above $103,000 instead of $3,000, institutional inflows are measured in billions rather than millions, and the market is more mature and globally integrated. But sentiment still reacts to political turning points, and traders are once again debating whether a post-shutdown rally could take shape.
Macro analysts note that major political events often trigger volatility across risk assets. The end of a shutdown removes uncertainty, stabilizes government operations, and can boost short-term liquidity, factors that historically benefit Bitcoin. Still, others argue that past performance shouldn’t be treated as a blueprint, especially given current market structure and global monetary conditions.


