


After months of steady gains, Bitcoin’s momentum is showing cracks. The leading cryptocurrency ended October down 6.84%, marking its first negative October since 2018 and the worst in 11 years, according to market analyst Joe Consorti. Historically, October has been one of Bitcoin’s strongest months, but this year’s performance is breaking that pattern, raising questions about whether the current cycle is nearing exhaustion or simply pausing before another leg higher.
Bitcoin is down 6.84% this month, making it the first red October since 2018, and the worst October in 11 years. pic.twitter.com/1YRs3rW3rb
— Joe Consorti ⚡️ (@JoeConsorti) October 30, 2025
Signs of Exhaustion or Just Another Reset?
Charts shared by Bitcoin News highlight a worrying historical pattern: the number of days investors spent at a loss has begun forming peaks that previously aligned with major cycle tops. Similar spikes occurred before the 2013, 2017, and 2021 highs, leading to large corrections each time. While the data doesn’t confirm a top, it shows market stress approaching levels historically tied to overheated sentiment.
Are the signs of a Bitcoin top in the room with us? pic.twitter.com/PFgSpSpdjF
— Bitcoin News (@BitcoinNewsCom) October 30, 2025
At the same time, Alpha Extract reported an “intra-buy” signal on its liquidity divergence indicator. Their data shows global liquidity is still expanding even as Bitcoin dips, a mismatch that typically resolves in a bullish reversal. “These disconnects don’t last long,” the firm noted, hinting that the recent pullback may represent opportunity rather than panic.
An intra-buy signal just triggered on our divergence indicator as well: $BTC is down while global liquidity is rising.
This is a classic setup – liquidity expanding while Bitcoin lags behind.
These disconnects don't last long.The advantage of having our own global liquidity… pic.twitter.com/g2R3iV6ACu
— Alpha Extract (@alphaextract_) October 30, 2025
Analysts See a Mid-November Bottom Potential
Crypto analyst Colin Talks Crypto believes the market remains in a long-term bull phase. He points to a possible Bitcoin bottom forming around mid-November, based on an expected intersection between the 50-day and 200-day moving averages, a pattern that historically precedes recoveries.
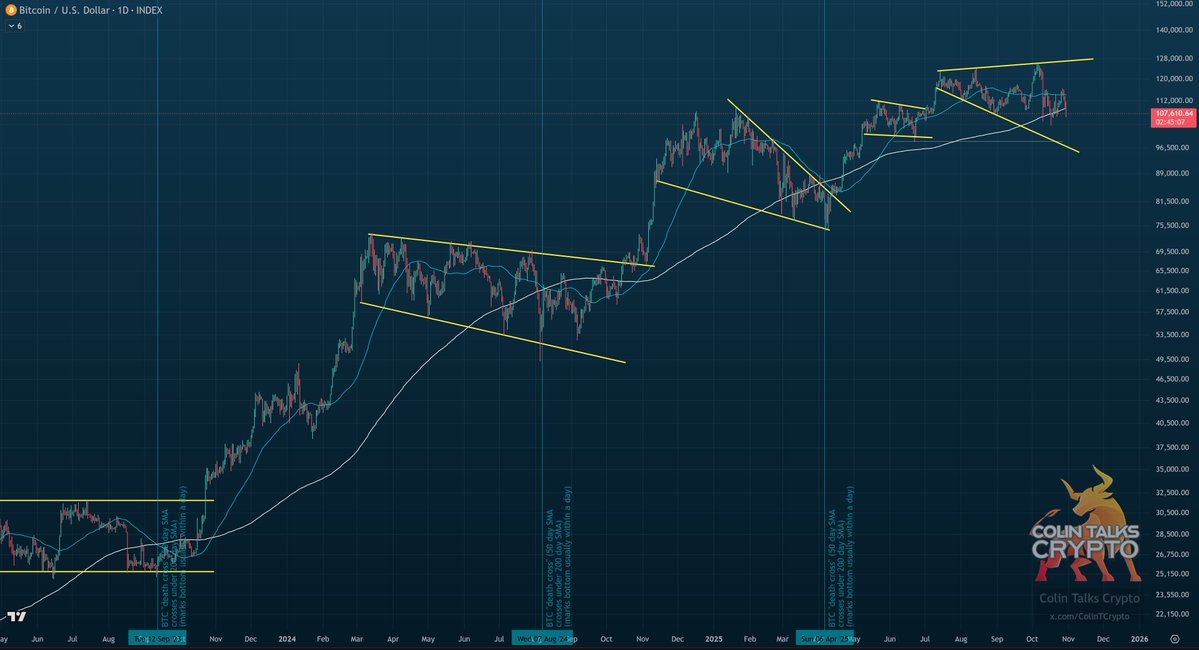
“The lowest I can see Bitcoin reasonably going is around $98,000,” he said, calling that zone a strong area of confluence and support. He also stressed patience: “The market is shaking the heck out of people right now. I think the best strategy is to stay with Bitcoin until it breaks new all-time highs.”
Risk Levels and Stress Indicators Suggest a Controlled Correction
Supporting that view, Bitcoin Vector observed that each retest of the $106,000–$108,000 zone has produced less stress on its Risk-Off Signal, meaning Bitcoin is absorbing volatility more efficiently. The firm warns, however, that the asset must soon reclaim the holders’ cost-basis zone to avoid extending the correction. If that support fails, downside pressure could accelerate.
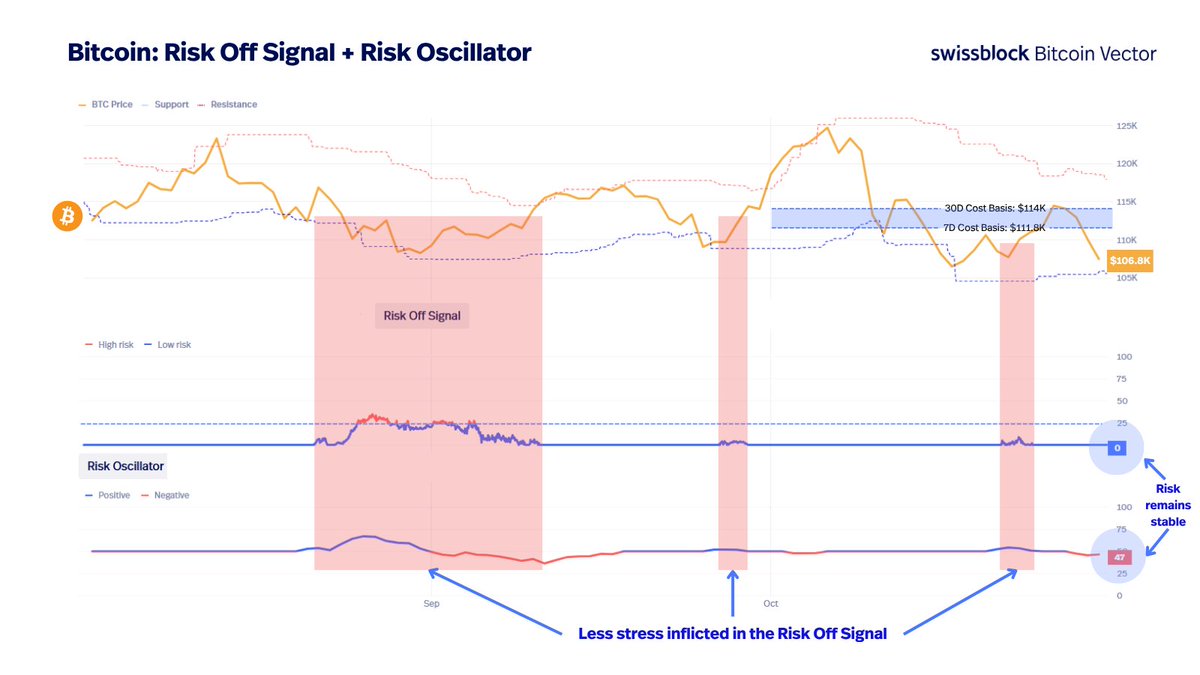
Still, metrics indicate stability rather than capitulation. The Risk Oscillator remains relatively calm, suggesting that large investors are holding positions instead of rushing to exit.
A Market Caught Between Fear and Frustration
Collectively, the signals paint a conflicted picture. Liquidity conditions are improving globally, yet capital flows into Bitcoin have slowed. Retail traders are cautious after October’s rare red close, while long-term holders appear unfazed. As Alpha Extract put it, Bitcoin’s “link to global liquidity keeps getting stronger,” implying that once flows align, volatility could flip bullish again.
Whether this moment represents a cycle top forming or a temporary bottom in progress, traders agree on one thing, patience is essential. With key support at $98,000–$106,000 and strong resistance near $115,000, the coming weeks may determine whether Bitcoin consolidates for a deeper retrace or reignites toward new highs.


