


More than 8% of Bitcoin’s total supply has moved in the past week, according to new Glassnode data, an extremely rare network event that has historically appeared only during deep market stress. The last two times this happened were December 2018, when Bitcoin bottomed near $3,500, and March 2020, during the COVID crash around $5,000.
The chart shows a dramatic surge in recently spent outputs, pushing above the red 8% threshold that has acted as a historical marker of capitulation.
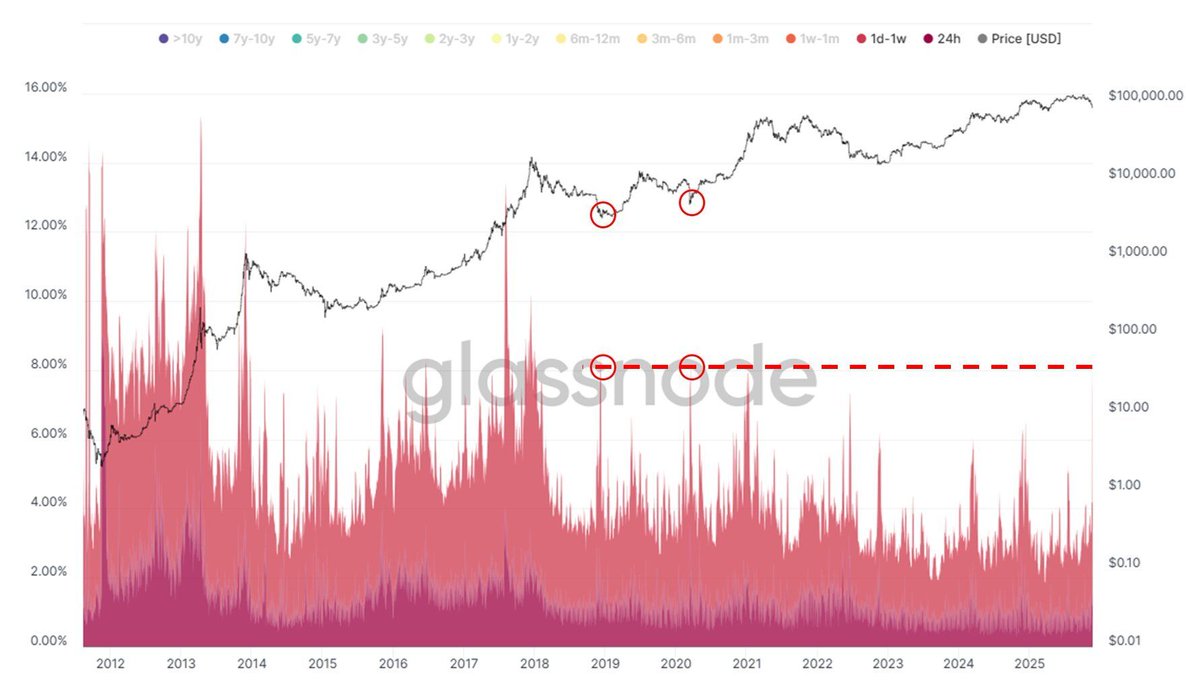
In both prior cases, this kind of movement reflected intense fear, heavy repositioning by long-term holders, and a rapid transfer of supply from weaker to stronger hands. Each episode preceded a major cyclical reversal.
Today’s spike falls into that same zone. A large portion of older coins has suddenly moved, implying that the market is undergoing a high-pressure transition phase, the kind that typically arrives at the end of a selloff rather than the beginning. The price chart above the activity bars reinforces this pattern, showing how past supply surges aligned with structural turning points.
While this doesn’t guarantee a bottom, such large-scale movement almost always signals a moment of extreme stress followed by renewed accumulation. Traders are now watching closely to see whether Bitcoin is setting up for another major shift in trend.


